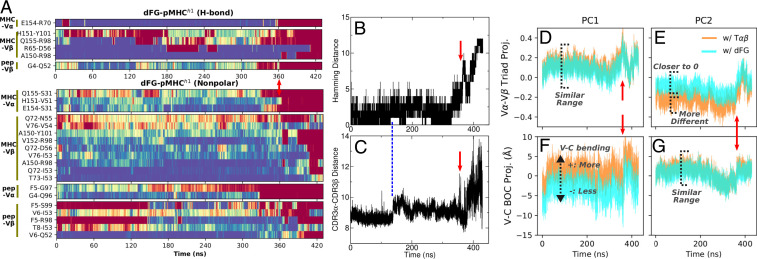
Fig. 5.
Dissociation process of dFG- (see SI Appendix, Fig. S6 for dFG-). Vertical red arrows are at the same time point (360 ns) across the figure, when a major disruption of the interface occurs. (A) Contact occupancy heat map, created the same way as in Fig. 2. Also see Movie S8. (B) Hamming distance (cf., Fig. 2C). (C) CDR3 distance (cf., Fig. 3E). Its increase at about 140 ns coincides with a modest increase in the Hamming distance (vertical dashed line). (D–G) Projection of V-V triads (D and E) and V-C BOC (F and G), onto the corresponding PCs of T and unliganded dFG as references.

