
Fig. 3.
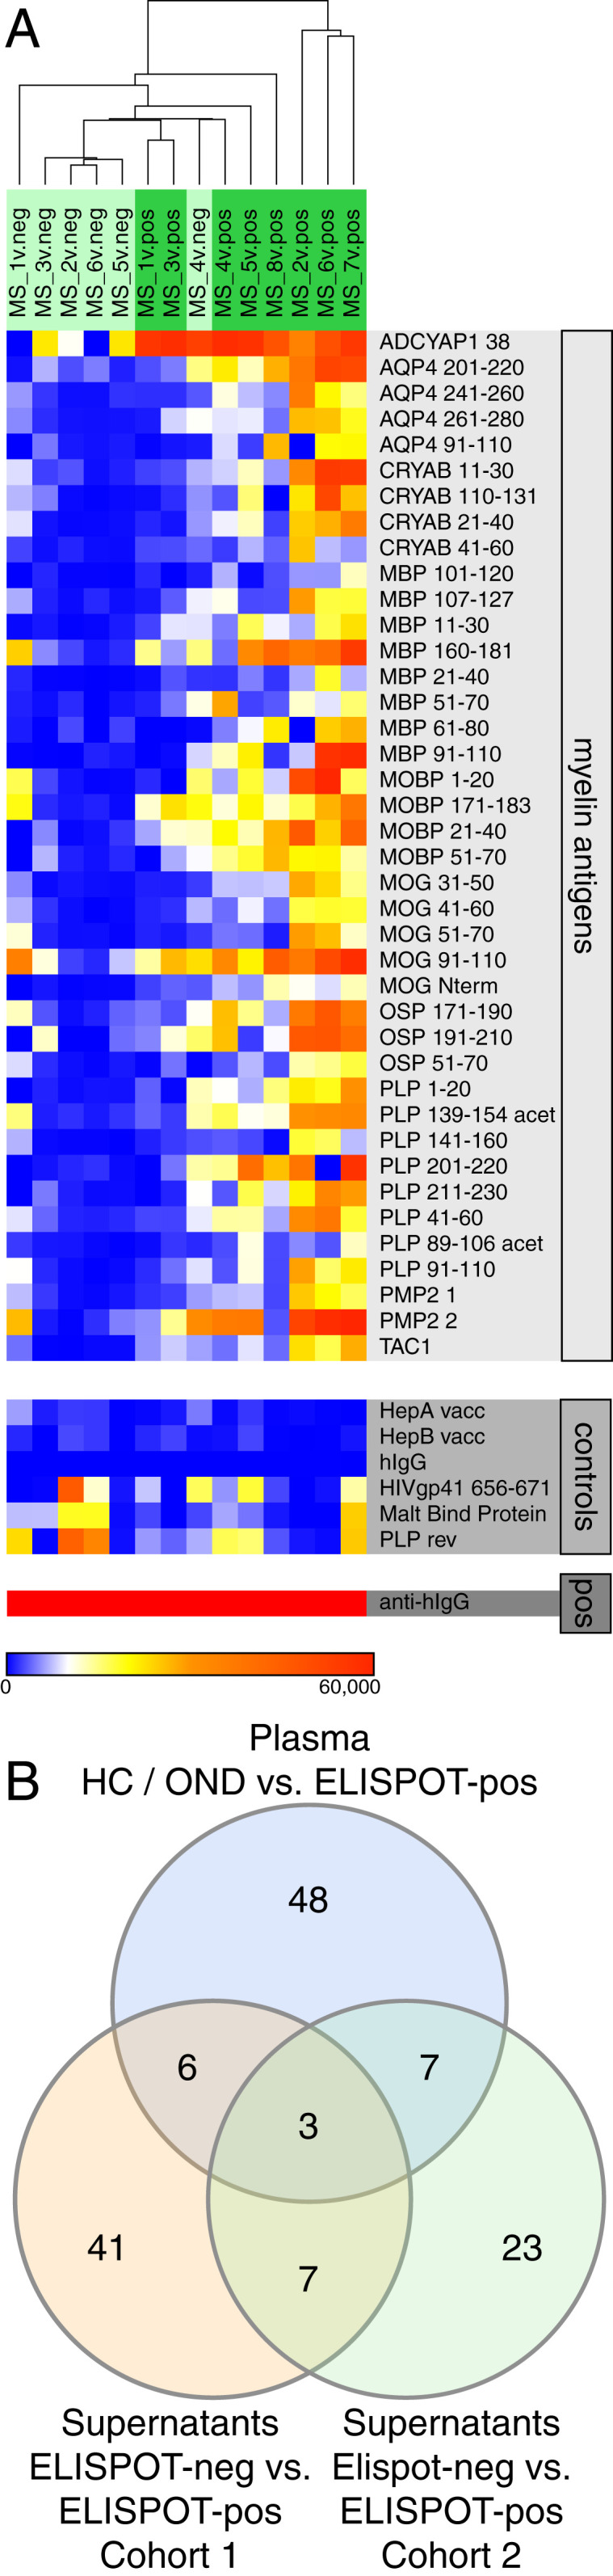
IgG reactivity in B cell supernatants, second cohort. (A) Heatmap of antibody reactivity (in MFI) against 40 myelin antigens identified as significantly different between ELISpot-neg vs. ELISpot-pos B cell supernatants in SAM analysis (Top), nonmyelin controls (Middle), and positive control (Bottom). (B) Venn diagram indicating the number of overlapping significant antigens among the comparisons of ELISpot-neg vs. ELISpot-pos (supernatants, cohort 1) (orange), ELISpot-neg vs. ELISpot-pos (supernatants, cohort 2) (green), and HC/OND vs. MS (plasma) (blue).