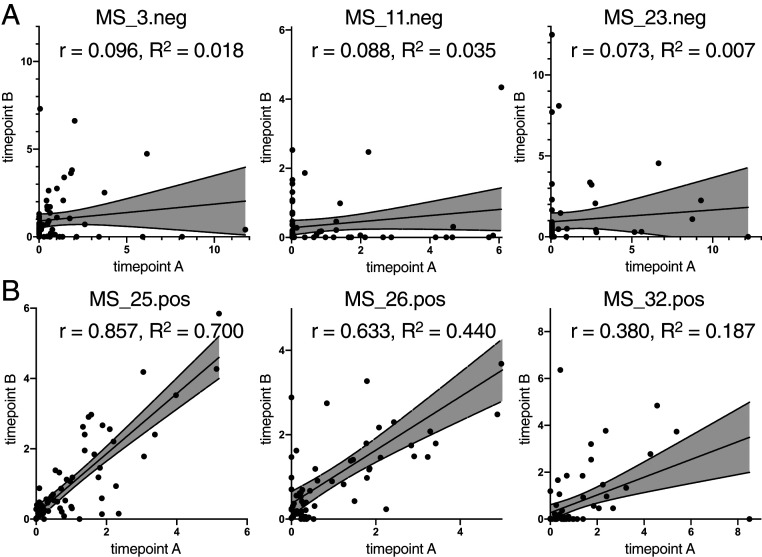
Fig. 4.
Antigen reactivity in B cell supernatants of individual MS patients over time. Scatterplots depict antibody reactivities (in MFI) of time point A (x-axes) and time point B (y-axes) 3 mo later in ELISpot-neg samples (A) and ELISpot-pos samples (B). The correlation coefficient, r, and coefficient of determination, R2, for each patient are indicated in each plot.

