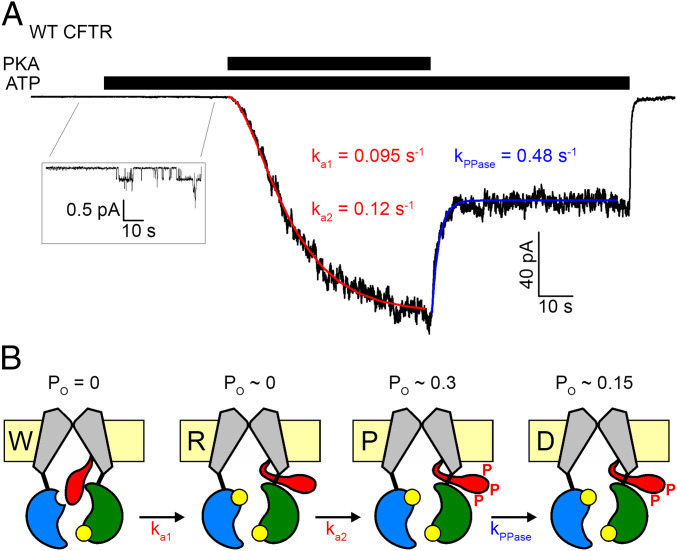
Fig. 1.
Prevailing mechanistic interpretation of CFTR activation by PKA. (A) Sigmoidal activation time course of macroscopic CFTR current in an inside out patch exposed to 2 mM ATP plus 300 nM PKA (black bars), and rapid partial deactivation upon PKA removal. Red and blue curves are fits to the two-step activation and the single-step partial deactivation process, respectively, depicted in B, with fitted rate constants plotted. (B) Cartoon interpretation of the data in A, by assuming sequential shuttling through channel states W (wedged in, Po = 0), R (released, Po vanishingly small; compare A, Inset) and P (phosphorylated, Po∼0.3) during activation, and from P to D (partially dephosphorylated, Po∼0.15) upon PKA removal. TMDs, gray; NBD1, blue; NBD2, green; R domain, red; ATP, yellow.

