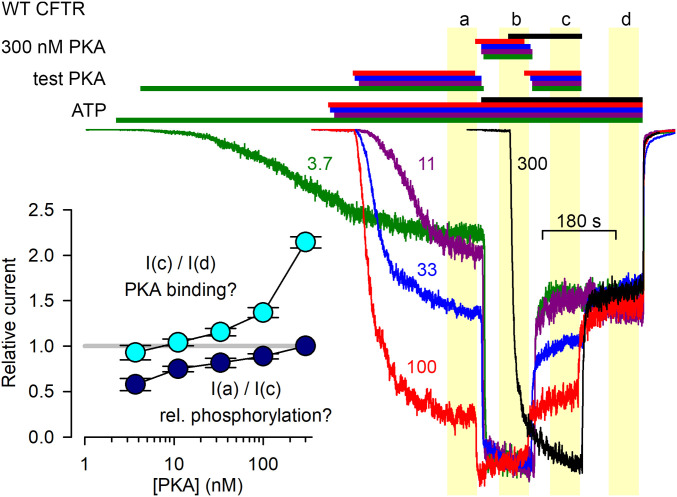
Fig. 2.
PKA-dependent CFTR current activation/deactivation time courses hint at the possibility of CFTR activation by PKA binding. Macroscopic CFTR currents from patches exposed, in sequential order, to test [PKA], 300 nM PKA, test [PKA], and 0 nM PKA, all in 2 mM ATP. Current traces and bars that identify exposure to compounds are color coded based on the value of the test [PKA] which is indicated (in nM) next to each trace. Final steady-state stretches of the four experimental segments are highlighted by yellow boxes and marked a through d. Currents were normalized to their average values in segment b, and are shown synchronized to the end of segment d. (Inset) Current-amplitude ratios [mean± SEM (n = 7–38)] between indicated experimental segments as a function of test [PKA].

