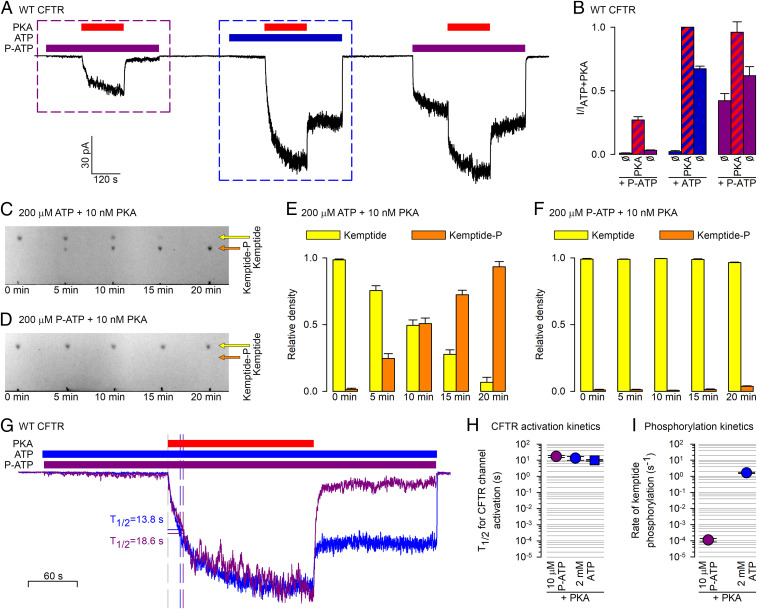
Fig. 3.
PKA cannot use P-ATP for phosphotransfer, but reversibly stimulates CFTR channels gating in P-ATP. (A) Macroscopic CFTR current in an inside out patch in response to repeated exposures to 300 nM PKA (red bars) in the presence of either 10 μM P-ATP (purple bars) or 2 mM ATP (blue bar). (B) Steady-state current amplitudes [mean ± SEM (n = 7–9)], normalized to that observed in ATP + PKA, for the nine segments of the experimental protocol shown in A, as indicated below the bars. (C and D) Kinetics of phosphorylation of TAMRA-kemptide (20 μM) by PKA (10 nM) in the presence of 200 μM ATP (C) or P-ATP (D), visualized by TLC. Yellow and orange arrows mark the positions of the spots corresponding to the dephospho- and phosphopeptide, respectively. (E and F) Densitometric analysis of the TLC sheets in C and D. Relative densities (Materials and Methods) of the dephospho- (yellow bars) and phospho-kemptide (orange bars) spots, plotted as a function of incubation time in PKA + ATP (E) or PKA+P-ATP (F). Bars plot mean ± SEM (n = 3). (G) Overlay of the segments of current (purple and blue trace) highlighted by the purple and blue boxes, respectively, in A, synchronized to the time points of PKA addition, and renormalized to their respective steady-state amplitudes in PKA. Vertical dashed lines identify the time points at which the currents reach 50% of their steady-state amplitudes (T1/2). (H) T1/2 of current activation for unphosphorylated CFTR channels upon exposure to 300 nM PKA first in 10 μM P-ATP (purple circle) and then in 2 mM ATP (blue circle). As a control, blue square depicts T1/2 of activation for channels exposed to 300 nM PKA + 2 mM ATP without prior exposure to PKA+P-ATP (compare Fig. 2, black trace). (I) Calculated rates (s−1) of TAMRA-kemptide phosphorylation by PKA in the presence of either 10 μM P-ATP (purple circle) or 2 mM ATP (blue circle). Note logarithmic ordinates in H and I.

