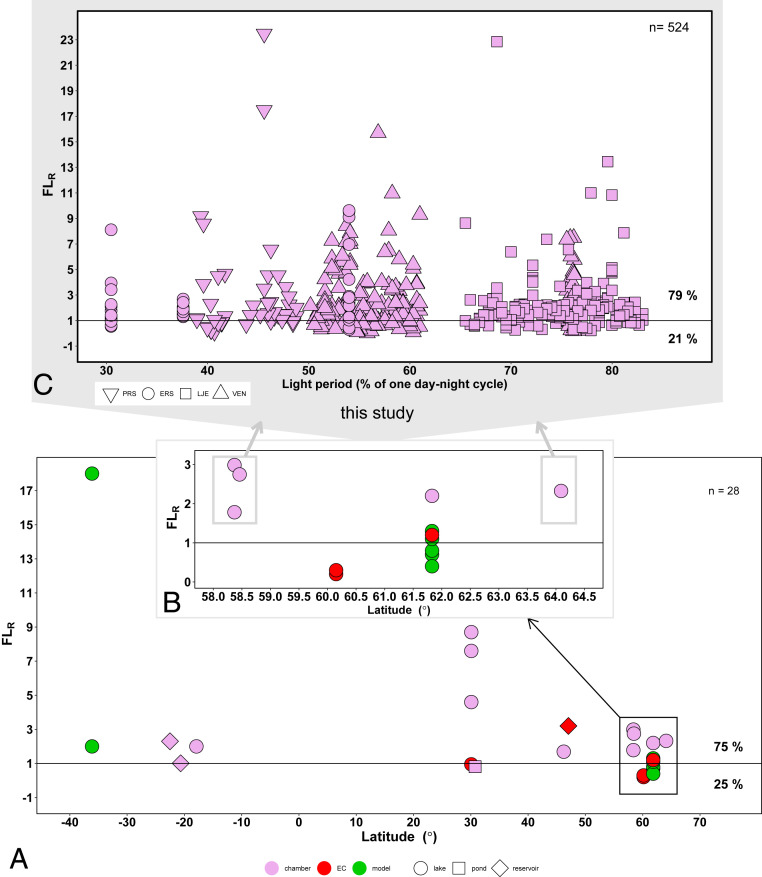
Fig. 3.
A and B show the average CH4 flux day:night ratio (FLR) in systems located in different latitudes (n = 28) (see also SI Appendix, Table S2) measured with different methods and including the average FLR values for each lake from this study. Symbols indicate the system where CH4 fluxes were measured and colors represent methods used to obtain CH4 flux, including floating chambers (chamber), EC, and gas transfer models (model); for details see SI Appendix, Table S2. C shows individual FLR (n = 524) in the lakes investigated in this study plotted against the length of the light period in each day-night cycle. Three values of FLR (27.1, 29.4, 41.1) are not displayed to increase resolution of the figure. For details on day-night cycle definition, see Materials and Methods.

