Fig. 5.
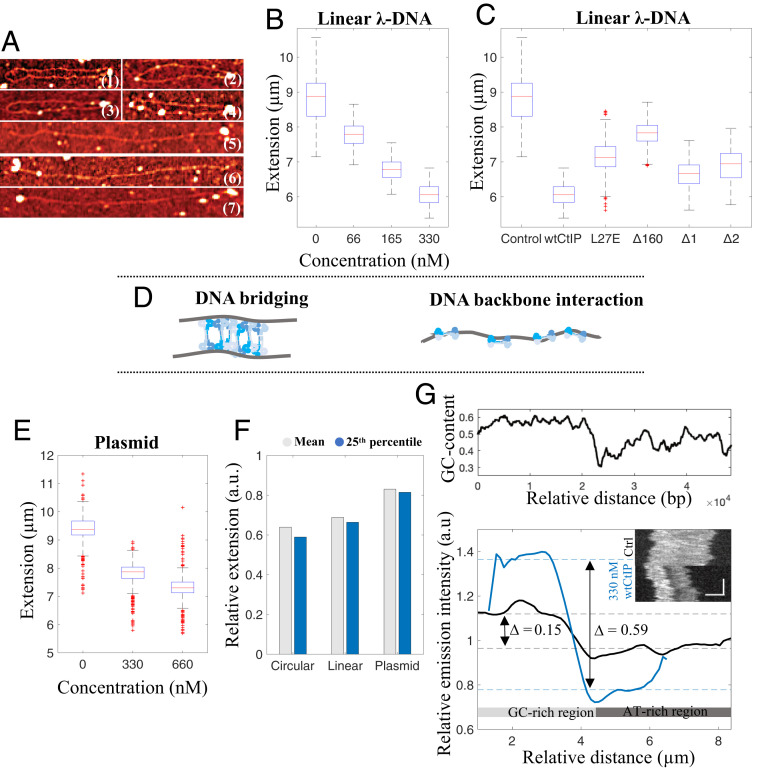
CtIP binds specifically to DNA ends and nonspecifically to the DNA backbone. (A) AFM images, showing circular (1 to 4) and linear (5 to 7) DNA-wtCtIP complexes, where features are reflected through the height difference. wtCtIP forms clusters (bright spots) along the contour of both circular and linear DNA molecules as well as at the ends of the linear molecules, suggesting two possible binding modes of CtIP to DNA. Noncropped images are presented in SI Appendix, Fig. S9. (B and C) Boxplots of the distribution of extensions for the nanoconfined linear fraction of λ-DNA–CtIP complexes at different protein concentrations of wtCtIP (B) and at a constant protein concentration of 330 nM for different protein variants (C). (D) Schematic illustration of the proposed DNA-binding mechanisms of CtIP, bridging and binding along the DNA backbone, respectively. (E) Boxplot of the extension of a nanoconfined 97-kbp circular plasmid at different concentrations of wtCtIP and a constant total DNA concentration of 4 µM bp. The blue box shows the interquartile range (Q2 = 25th percentile, Q3 = 75th percentile) with the median extension (red). Whiskers represent ranges for minimum and maximum, and outliers are represented by red crosses. Datapoints deviating by 1.5 times of the interquartile range are considered outliers. (F) Bar diagram showing the molecule extension relative to control DNA (no protein) for nanoconfined circularized and linear λ-DNA molecules (Circular and Linear, respectively) and for the 97-kbp circular plasmid (Plasmid) at a total DNA concentration of 4 µM bp in the presence of 330 nM wtCtIP. The gray bar represents the mean value for the whole population, whereas the blue bar takes into account only the 25th percentile. The plasmid DNA displays less compaction compared with circularized and linear λ-DNA. (G, Top) The local GC-content along nanoconfined λ-DNA where a moving average filter has been applied with a step size of 1,000 bp. (G, Bottom) Emission intensity variation along the molecule extension for bare λ-DNA (black; n = 50) and λ-DNA in the presence of 330 nM wtCtIP (blue; n = 96), with corresponding representative kymographs as inserts. Color-coded dashed lines mark the median emission values for the first and second halves of the molecule extension, representing the GC-rich (higher emission) and AT-rich (lower emission) regions, respectively. The vertical and horizontal scale bars correspond to 3 s and 3 µm, respectively.

