Fig. 2.
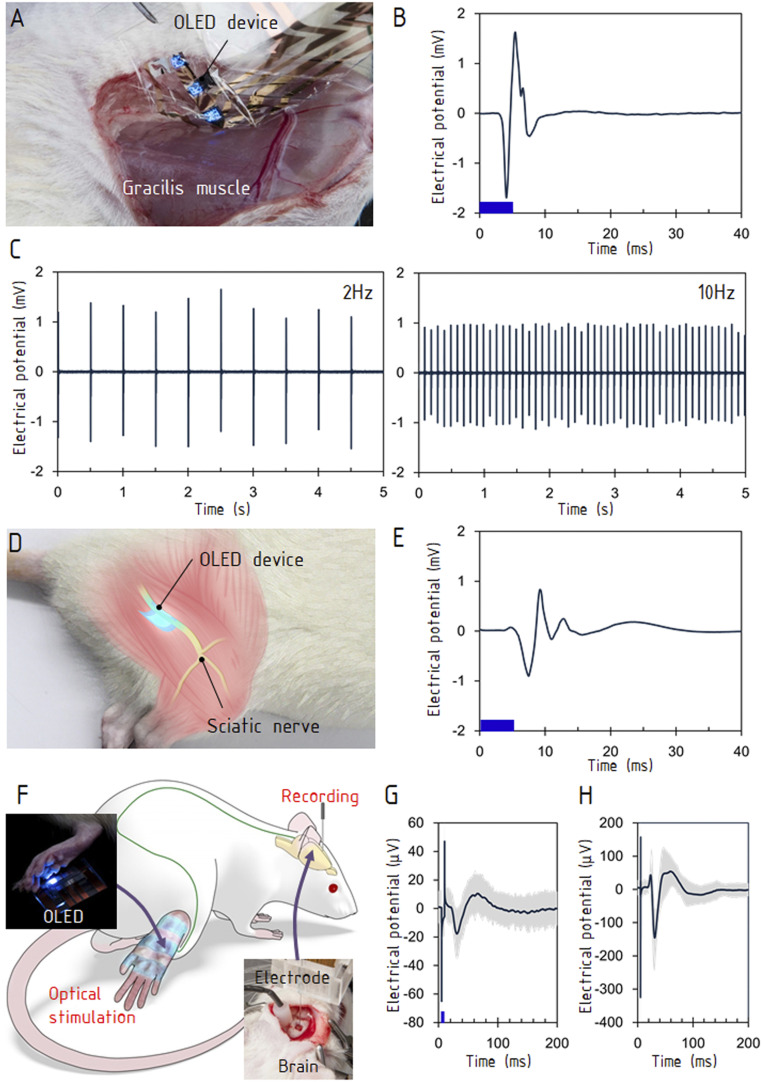
Stimulations of motor and sensory systems. (A) The OLED was attached to a surface of gracilis muscle (Materials and Methods). (B) The evoked electromyogram. The stimulation frequency was 10 Hz, and the data were averaged over 10 stimulations. (C) The evoked electromyograms at 2 and 10 Hz. (D) The OLED was placed on the exposed sciatic nerve of the hindlimb. (E) The evoked electromyogram at the gastrocnemius muscle. The stimulation frequency was 10 Hz, and the data were averaged over 10 stimulations. (F) The experimental setup for stimulating sensory neurons in the hindlimb and recording the somatosensory evoked potential in the brain. The lower right photograph shows the needle electrode inserted into the primary somatosensory cortex (S1) contralateral to the stimulated hindlimb. The upper left photograph shows the OLED attached to the hindlimb. (G) Electrical potentials evoked by optical stimulations. The first negative peak occurred ∼25 ms after stimulation, and the peak pair at <10 ms was an artifact caused by the stimulation. (H) Evoked potentials by electrical stimulations to the hindlimb. The stimulus intensity and duration were 0.7 mA and 300 μs, respectively. The blue bars in B, E, and G show the durations of optical stimulations (5 ms).

