Fig. 4.
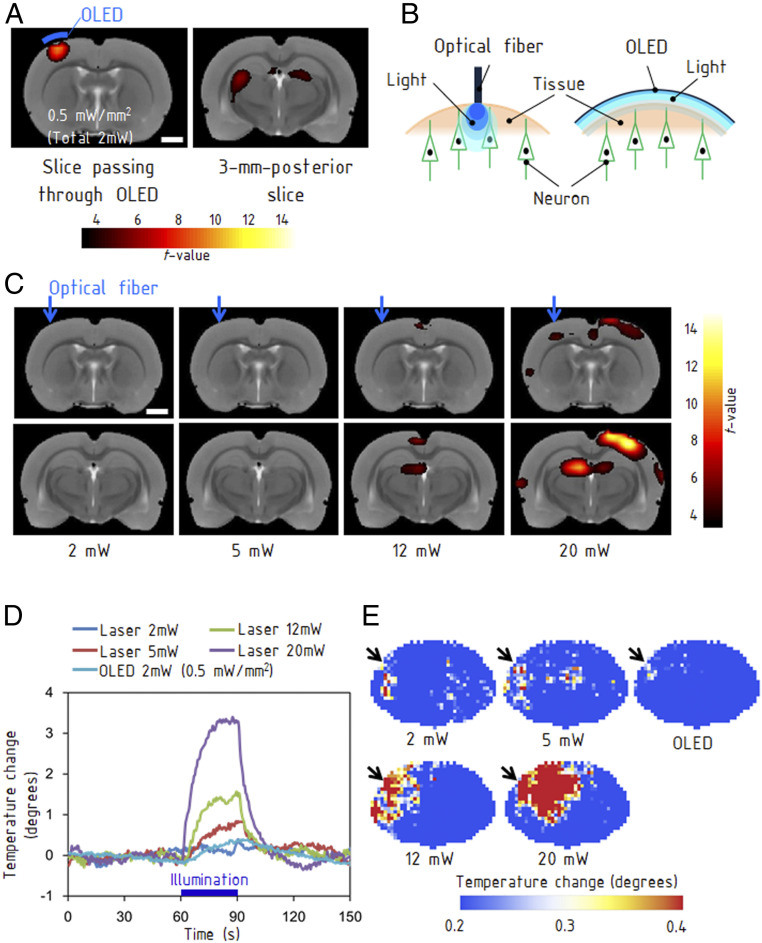
MRI of brain activities evoked by optical stimulations. (A) The left map shows activation in the sensorimotor cortex, which was located immediately below the OLED emission area (Materials and Methods). The right map shows the induced activation in the thalamus 3 mm posterior to the stimulated area. (Scale bars, 2 mm.) (B) Difference between the OLED providing an area light source and an optical fiber providing a point light source. (C) fMRI obtained with stimulations from a fiber-coupled laser with light powers ranging from 2 to 20 mW. BOLD responses were evoked at 12 mW and higher. The images in the bottom row are at 3 mm posterior from the images in the top row. (Scale bars, 2 mm.) (D) Rise in temperature caused by illumination with the OLED and fiber-coupled laser. The measurements were performed on a rat brain with a craniotomy of 4 mm × 4 mm using a thermocouple. (E) Thermographs for each light power. The illumination using the optical fiber generated a hot spot, whereas the OLED caused a much smaller thermal effect. The measurements were performed using an extracted brain.

