Fig. 4.
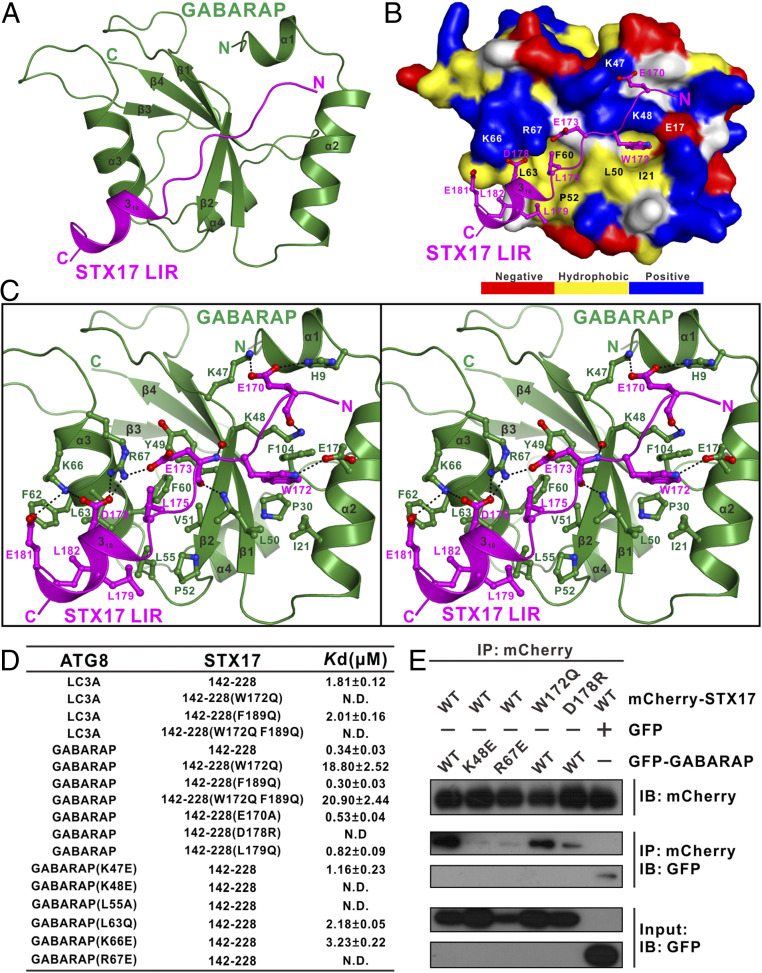
Structural analyses of the STX17 LIR–GABARAP complex. (A) Ribbon diagram showing the overall structure of the STX17 LIR–GABARAP complex. In this drawing, GABARAP is shown in forest green, and the STX17 LIR motif is in magenta. (B) The combined surface representation and ribbon-stick model showing the molecular interface of GABARAP in the STX17 LIR–GABARAP complex. In this representation, GABARAP is shown in the surface model and STX17 LIR is in the ribbon-stick model. The hydrophobic amino acid residues of GABARAP in the surface model are drawn in yellow, the positively charged residues are in blue, the negatively charged residues are in red, and the uncharged polar residues are in gray. (C) Stereoview of the ribbon-stick representation showing the detailed interactions between GABARAP and STX17 LIR. In this drawing, the side chains of the key residues are shown in stick-ball mode, and the hydrogen bonds involved in the binding are shown as dotted lines. (D) The measured binding affinities between various forms of GABARAP–LC3A and the STX17 Qa-SNARE motif or their mutants by ITC-based analyses. (E) Mutagenesis-based co-IP assays confirming the interactions between GABARAP and STX17 observed in the determined STX17 LIR–GABARAP complex structure. IB, immunoblotting.

