
Figure 1.
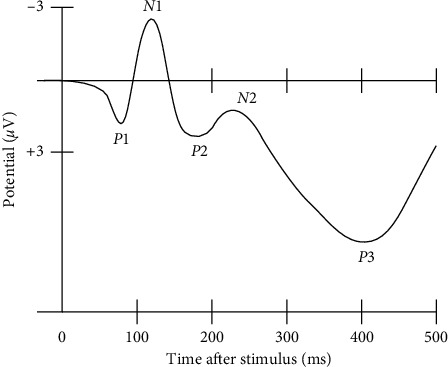
A waveform showing several ERP components, including the N200 (labelled N2) and P300 (labelled P3). Note that the ERP is plotted with negative voltages at the top, a common, but not universal, practice in ERP research [38].
Official websites use .gov
A
.gov website belongs to an official
government organization in the United States.
Secure .gov websites use HTTPS
A lock (
) or https:// means you've safely
connected to the .gov website. Share sensitive
information only on official, secure websites.
A waveform showing several ERP components, including the N200 (labelled N2) and P300 (labelled P3). Note that the ERP is plotted with negative voltages at the top, a common, but not universal, practice in ERP research [38].