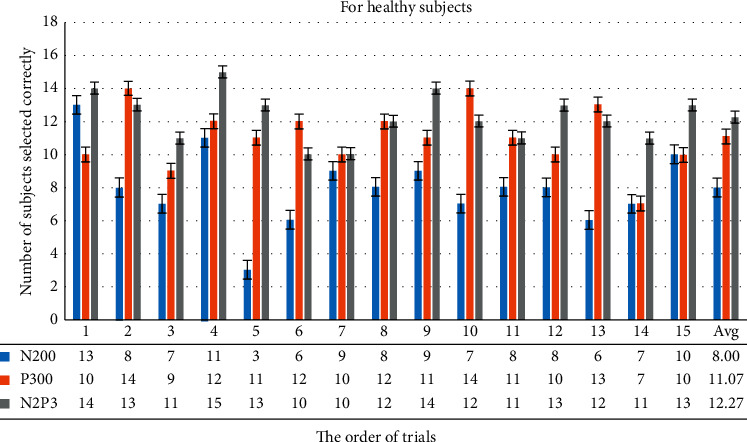
Figure 10.

This bar chart summarizes the number of correct selections for each healthy subject for each trial. For example, if the system uses N2P3 to interpret the EEG, the choices from 14 of all 15 users are correct in the first trial, while N200 13 are correct, and only 10 are correct for P300.
