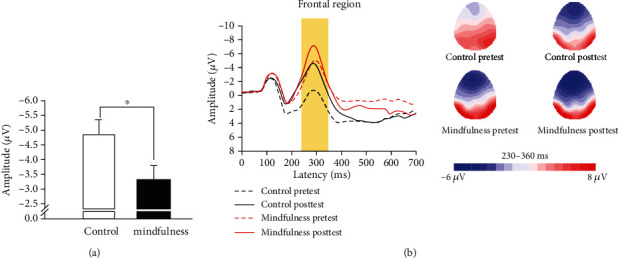
Figure 3.

(a) Postintervention scores (M ± SE) between the mindfulness and control group after controlling for the preintervention scores for N2 amplitude of event-related potential. (b) Grand average of event-related potential at the frontal region across congruency in the group and time point as well as topographic scalp distribution of the N2 amplitude collapsed across congruency in group and time point.
