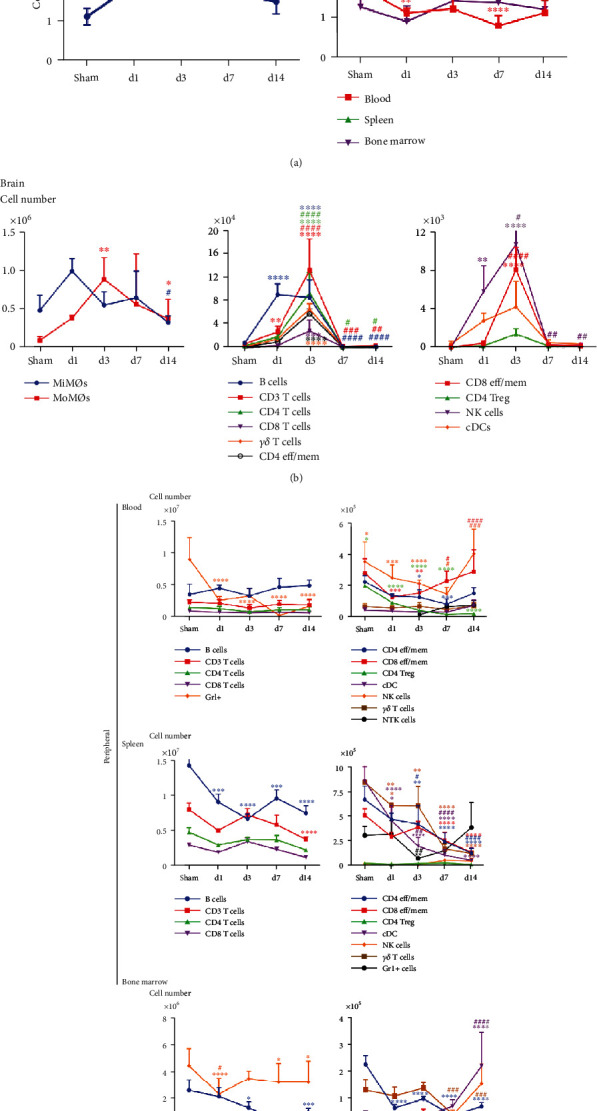
Figure 2.

The trend of cell number changes in different tissues among acute, subacute, and chronic stages after MCAO in mice. (a) Total cell number changes in the brain, blood, spleen, and bone marrow from sham, day 1, day 3, day 7, and day 14. (b) Changes in various immune cell numbers in the sham group brain and day 1, day 3, day 7, and day 14 after stroke. Based on the cell numbers, the brain immune cells were divided into three different groups. The first group (Figure 2(b), left) includes MoMØs and MiMØs. P = 0.06 (MiMØs, sham control vs. day 1 group). The second group (Figure 2(b), middle) includes B cells, CD3 T cell, CD4 T cells, CD8 T cells, γδT cells, and CD4 TEFF/MEM cells. The third group (Figure 2(b), right) includes CD8 TEFF/MEM cells, Treg cells, NK cells, and cDCs. (c) Changes in various immune cell numbers in the peripheral blood, spleen, and bone marrow from the sham group and day 1, day 3, day 7, and day 14 after stroke. Based on the cell numbers, cells were divided into two groups. The first group (on the left) includes B cells, CD3 T cell, CD4 T cells, CD8 T cells, and Gr1+ cells (in the spleen, GR1+ cells were listed in the second group). The second group (on the right) includes CD4 TEFF/MEM cells, CD8 TEFF/MEM cells, γδT cells, Treg cells, NK cells, and cDCs. ∗Sham vs. different time points. #1 d vs. various time points. ∗/#P < 0.05, ∗∗/##P < 0.01, ∗∗∗/###P < 0.001, and ∗∗∗∗/####P < 0.0001.
