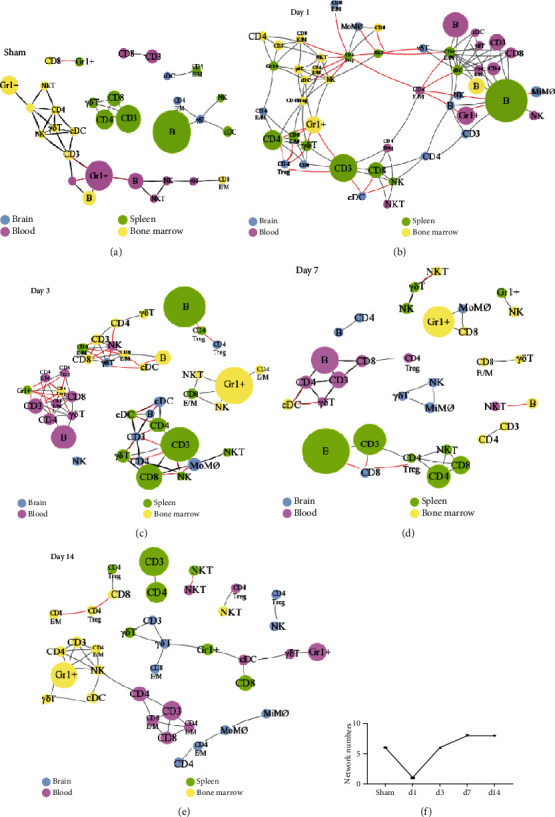
Figure 5.

R programming analyses for various immune cell correlations among different organs after stroke. The leukocyte samples were isolated from the brain, blood, spleen, and bone marrow from animals euthanized at day 1, day 3, day 7, and day 14 poststroke. The correlations were analyzed based on cell numbers by using R programming language. Blue circles represent the immune cells from the brain; purple, green, and yellow represent the immune cells from the blood, spleen, and bone marrow, respectively. The red line represents a positive correlation while the black line represents a negative correlation. Immune cell networks present at different time points: (a) sham; (b) day 1; (c) day 3; (d) day 7; (e) day 14. (f) Network numbers from different days after stroke and sham animals are depicted.
