
Figure 7.
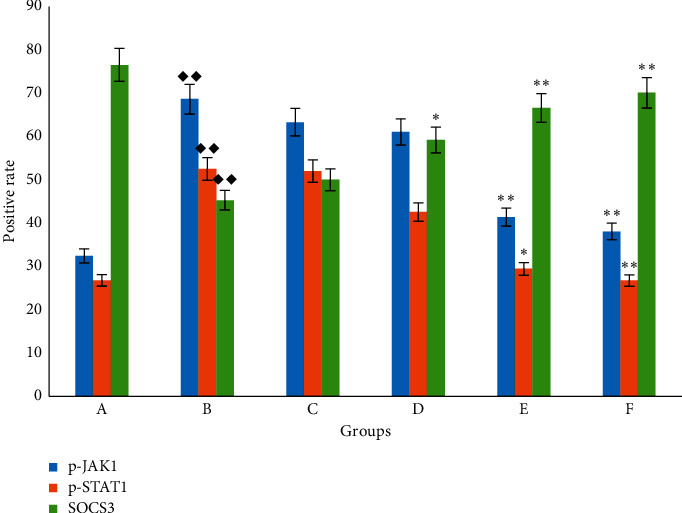
The positive rate of p-JAK1, p-STAT1, and SOCS3 with immunohistochemical staining. A: blank (control) group; B: BLM group; C: low-dose FOFB group; D: middle-dose FOFB group; E: high-dose FOFB group; F: prednisone group. Compared with blank group ◆p < 0.05, ◆◆p < 0.01; compared with the BLM group ∗p < 0.05, ∗∗p < 0.01; compared with the prednisone acetate group #p < 0.05, ##p < 0.01.