Figure 3.

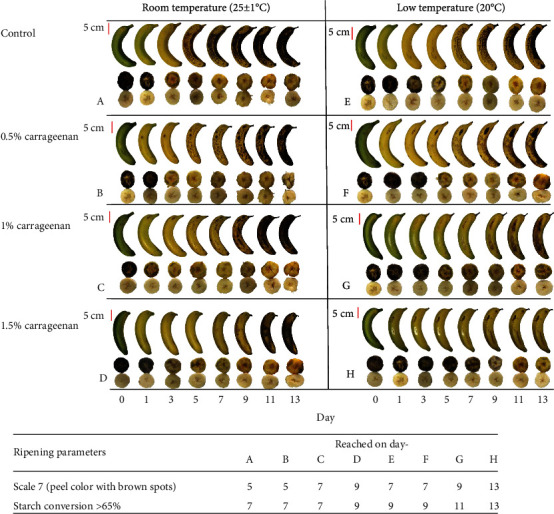
Change in peel color and starch conversion analysis by starch iodine stain from day 0 to day 13 in banana from different treatments. Treatment groups are coded by alphabets A to H. Data shown was one of three biological replicates.

Change in peel color and starch conversion analysis by starch iodine stain from day 0 to day 13 in banana from different treatments. Treatment groups are coded by alphabets A to H. Data shown was one of three biological replicates.