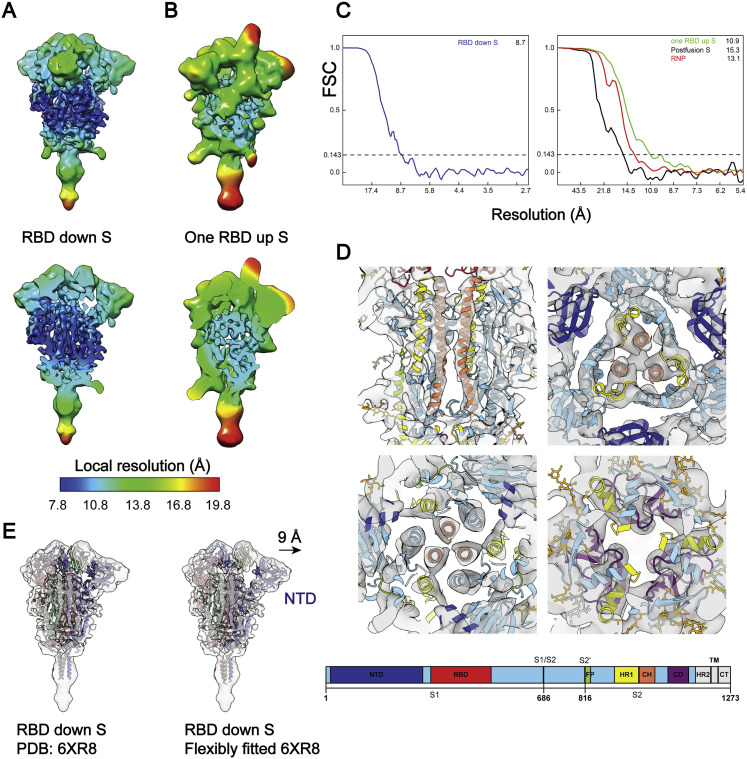
Figure S3.
Local Resolution and Fourier Shell Correlation (FSC) Curves, Related to Figure 2
(A, B) Maps of prefusion S in RBD down or one RBD up conformations are colored by their local resolution ranging between 7.8-19.8 Å. Among all domains, the central helical (CH) region is the best resolved, as evidenced by tubular densities of the alpha-helix bundles. (C) Resolution of the spikes in RBD down, one RBD up, the postfusion conformations, and the RNP was estimated from the FSC curves, using a criterion 0.143. (D) The best solved domains of the RBD down S, HR1 and CH from the S2 subunit, are highlighted with the fitted PDB: 6XR8. The domains are colored as in the schematic. NTD, N-terminal domain; RBD, receptor binding domain; S1/S2, S1/S2 cleavage site; S2′, S2′ cleavage site; FP, fusion peptide; HR1, heptad repeat 1; CH, central helix; CD, connector domain; HR2, heptad repeat 2; TM, transmembrane anchor; CT, cytoplasmic tail. (E) Comparison of the rigidly and flexibly fitted PDB: 6XR8 to the RBD down S. The NTD has shifted by 9 Å away from the CH (centroid distance).

