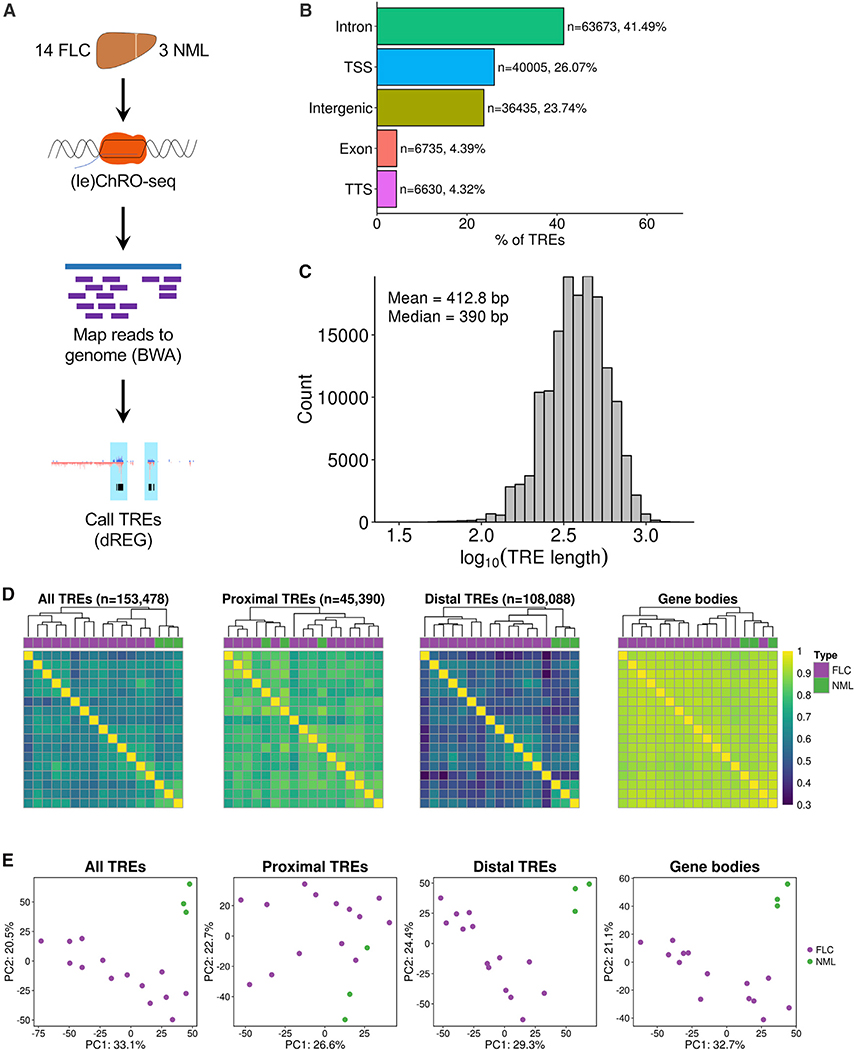
Figure 1. ChRO-Seq Analysis of Fibrolamellar Carcinoma (FLC) and Nonmalignant Liver (NML) Tissue.
(A) Diagram of (le)ChRO-seq workflow.
(B) Bar graph showing the distribution of genomic locations of TREs identified by ChRO-seq. Genomic locations are defined by HOMER using GENCODE v25 annotations.
(C) Length distribution of TREs identified by ChRO-seq.
(D) Heatmap of pairwise correlation analysis of TRE activity profiles. Hierarchical clustering was performed using Euclidean distance and Ward’s minimum variance method. Color bar shows Spearman’s correlation coefficient. TREs were classified based on GENCODE v25 annotations.
(E) Principal-component analysis of TRE activity profiles. Analyses were performed using the 1,000 most variable TREs following variance stabilizing transformation (DESeq2). The axes display the first two principal components and the variance explained by each component. PC, principal component; TSS, transcription start site; TTS, transcription termination site.

