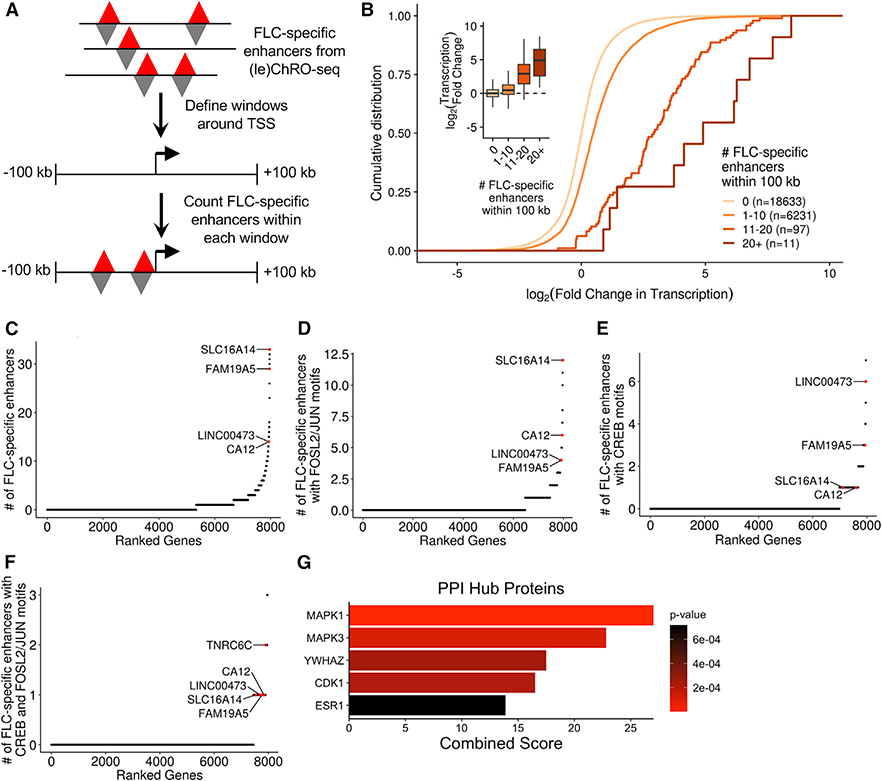
Figure 3. Identification of Genes Near Dense Clusters of FLC-Specific Enhancers.
(A) Schematic of the approach used to link FLC-specific enhancers to candidate genes. Gene windows were defined as 100 kb upstream and 100 kb downstream of each TSS.
(B) Cumulative distribution function and boxplots (inset) showing the relationship between the number of FLC-specific enhancers within each gene window and the transcriptional fold change in FLC compared to NML. Genes were binned based on the number of FLC-specific enhancers within their gene window and included in the analysis if they were transcribed with a threshold of TPM> 1 (ChRO-seq) in either FLC or NML.
(C–F) Genes ranked based on the density of FLC-specific enhancers (C), FLC-specific enhancers with FOSL2/JUN motifs (D), FLC-specific enhancers with CREB motifs (E), or FLC-specific enhancers with both FOSL2/JUN and CREB motifs (F) within their gene windows. Genes were included in the analysis if they were highly transcribed (ChRO-seq TPM ≥ 25).
(G) Protein-protein interaction (PPI) hub enrichment of genes with at least one FLC-specific enhancer containing both FOSL2/JUN and CREB motifs within 100 kb of the TSS. PPI p values were calculated by Enrichr using Fisher’s exact test.

