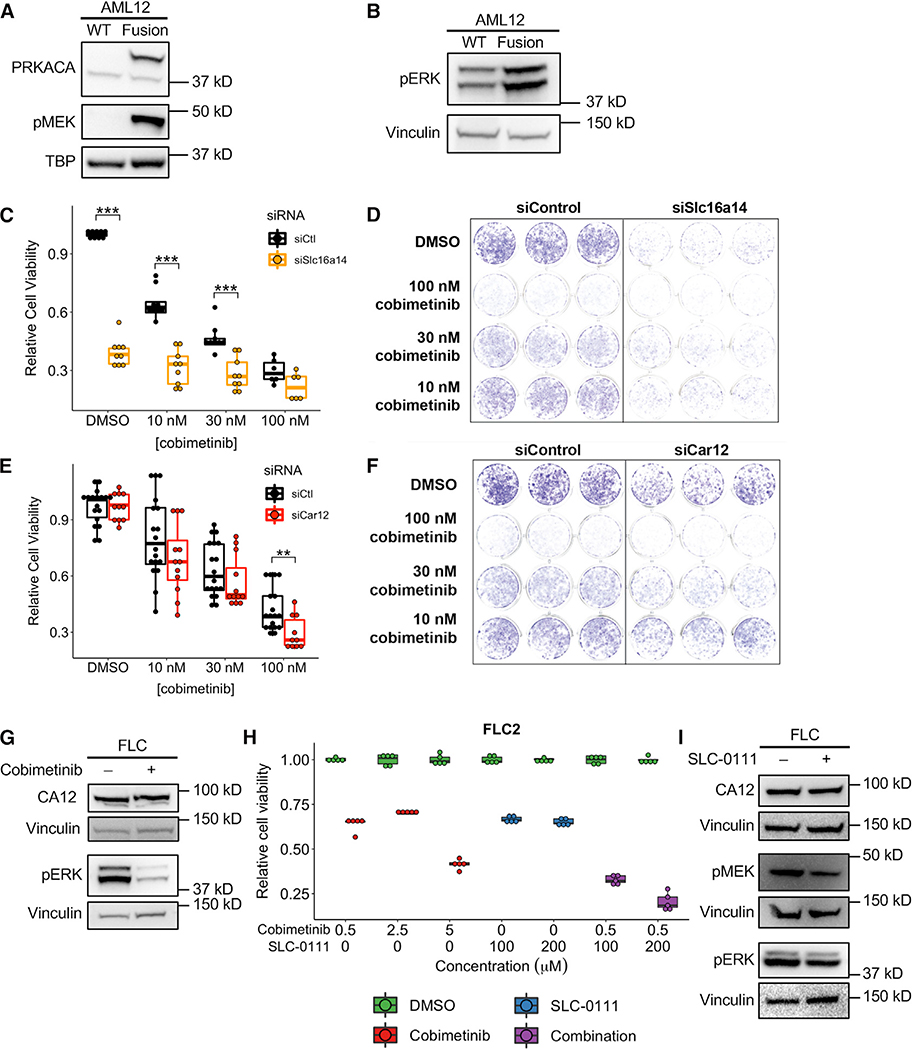
Figure 7. Identification of Potential Therapeutic Vulnerabilities in FLC.
(A and B) Western blot in WT AML12 cells and AML12 cells expressing the Dnajb1-Prkaca fusion demonstrating elevated MEK (A) and ERK (B) phosphorylation in cells expressing the fusion. Data are representative of two or more independent experiments.
(C and E) Cell viability quantified by crystal violet staining in AML12 cells expressing the Dnajb1-Prkaca fusion. Cells were treated with a siRNA targeting Slc16a14 (C) and Car12 (E) or a control siRNA and multiple concentrations of the MEK inhibitor cobimetinib. Data are presented from three or more independent experiments.
(D and F) Representative wells for cells treated with multiple concentrations of cobimetinib and siRNA targeting Slc16a14 (D) and Car12 (F) or a control siRNA and stained with crystal violet. Data are representative of more than three experiments.
(G) Western blot in FLC cells treated with 2.5 μM cobimetinib and probed with antibodies detecting CA12 or phosphorylated ERK. Data are representative of two independent experiments.
(H) Cell viability quantified by CellTiter-Glo in FLC cells treated with cobimetinib alone or the combination of cobimetinib and SLC-0111. All comparisons between DMSO and treatment were statistically significant (p < 0.01). Data are presented from five or more biological replicates from a single FLC cell line derivation. Results from additional cell line derivations are shown in Figure S6.
(I) Western blot in FLC cells treated with 200 μM SLC-0111 and probed with antibodies detecting CA12, phosphorylated MEK, or phosphorylated ERK. Data are representative of two independent experiments. **p < 0.01, ***p < 0.001 (two-sided Mann-Whitney U test).

