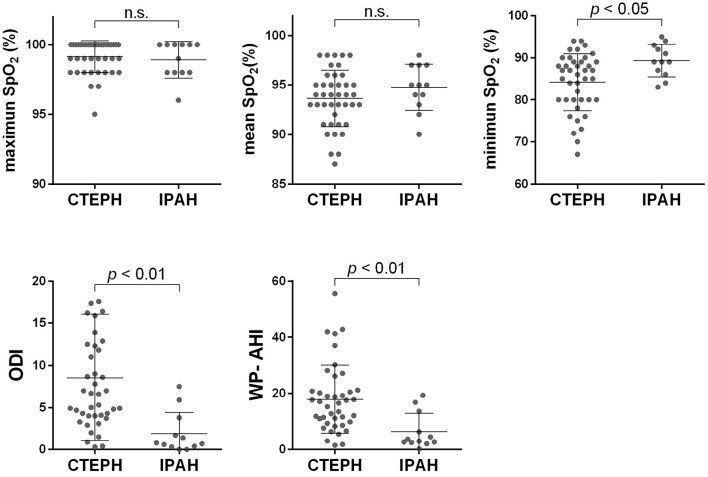
Figure 1.
The WatchPAT parameters in patients with CTEPH and IPAH. The maximum SpO2 levels did not differ markedly between the two groups; however, the minimum SpO2 was lower and the mean SpO2 tended to be lower in the CTEPH group than in the IPAH group. The WP-AHI and ODI were both higher in the CTEPH group than in the IPAH group.

