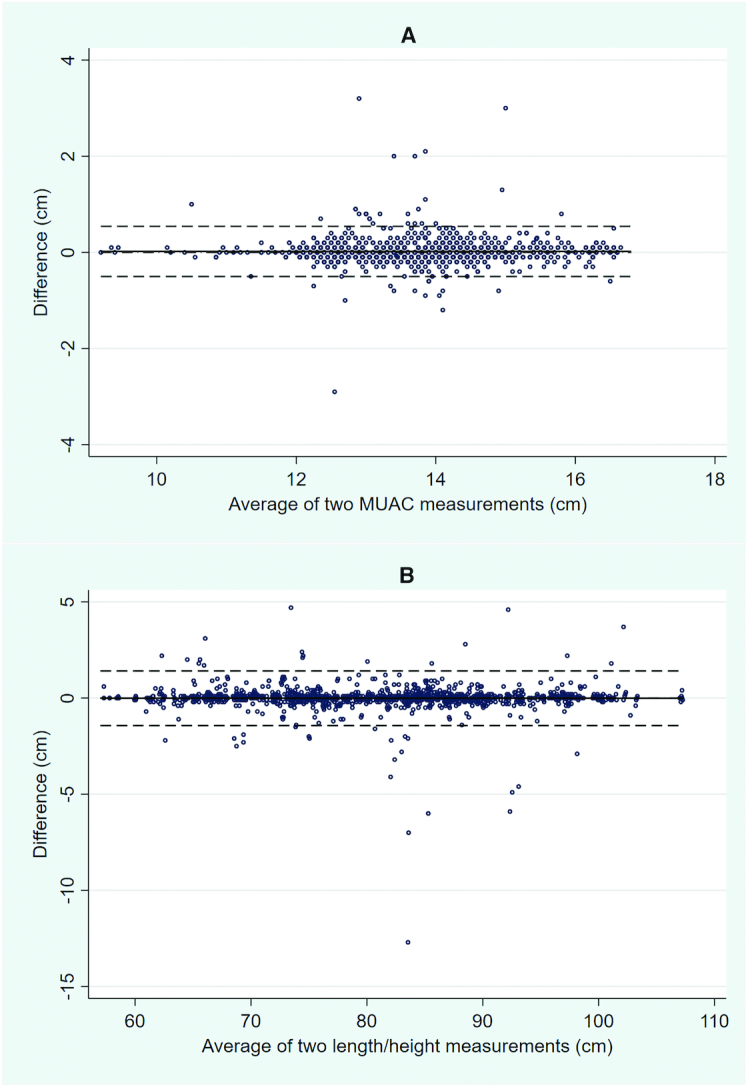
FIGURE 3.

Bland–Altman plots for intraobserver measurements of MUAC (A) and length/height (B). Differences in measurement (y axis) are plotted against the average of the 2 measurements (x axis) taken by the same observer. Dashed lines represent the 95% limits of agreement (mean difference ± 2 SD). MUAC, midupper arm circumference.
