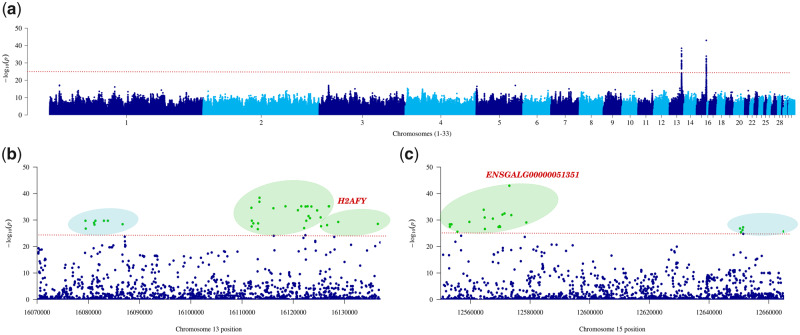
Fig. 2.
Foot feathering is associated with two genomic regions. (a) Genome-wide manhattan plot. The –log10(P) for each variant is shown in the y-axis. Two clear signals can be observed on chromosomes 13 and 15, respectively. (b) Manhattan plot of chromosome 13 (16.0–16.2 Mb). (c) Manhattan plot of chromosome 15 (12.5–12.6 Mb). Significant variants associated with protein-coding genes and lncRNAs are highlighted in green. Intergenic variants are highlighted in light blue. The significant P value threshold (P value <1.0e-25) is identified by the red dotted line.

