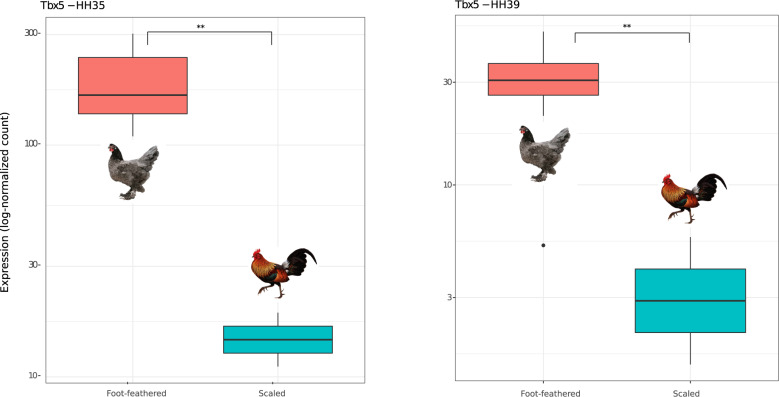
Fig. 5.
TBX5 is upregulated in the hindlimb of foot-feathered embryos. Expression values of TBX5 are shown in the y-axis as log-normalized counts at HH35 (left) and HH39 (right). Differences in expression between foot-feathered and scaled birds were significant based on the adjusted P value at stage HH35 (q-value: 2.49e-14) and HH39 (q-value: 6.87e-03). **q-value <0.05.

