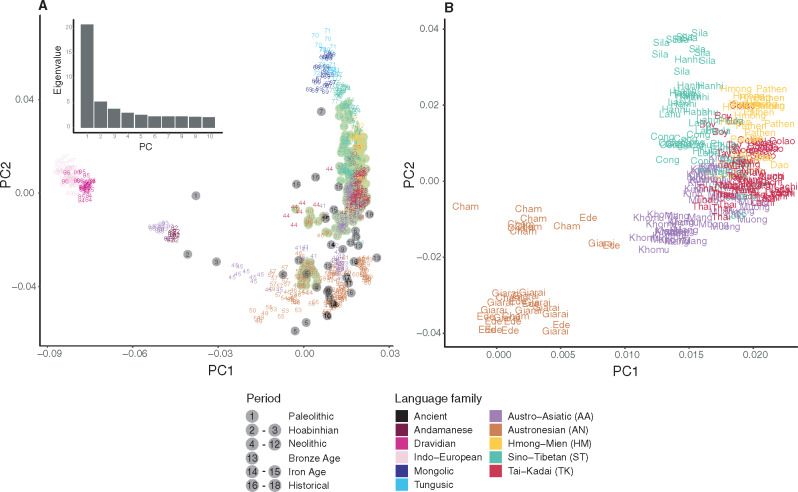
Fig. 2.
PCA analyses. (A) PCA analysis of 712 individuals and 33,666 SNPs, with individuals colored according to language families. The more isolated modern populations (Mamanwa, Mlabri, Onge, and Jehai) and the ancient samples were projected. The eigenvalues from PC1 to PC10 are shown in the top left corner. Ancient samples are shown as gray dots, whereas the present-day Vietnamese are shown as light green dots. Each population and ancient sample is numbered according to supplementary table S1, Supplementary Material online. (B) Vietnamese populations only, zoomed-in from (A).

