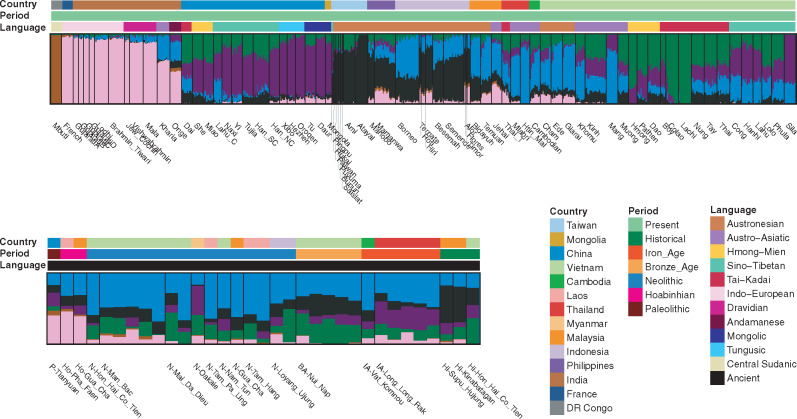
Fig. 3.
ADMIXTURE analyses. ADMIXTURE result for K = 6, which minimized the cross-validation error (supplementary fig. S4, Supplementary Material online). Regions are labeled at the top, whereas population/ancient sample names are labeled at the bottom. The color bar denotes the language families and time periods for the modern and ancient samples, respectively.

