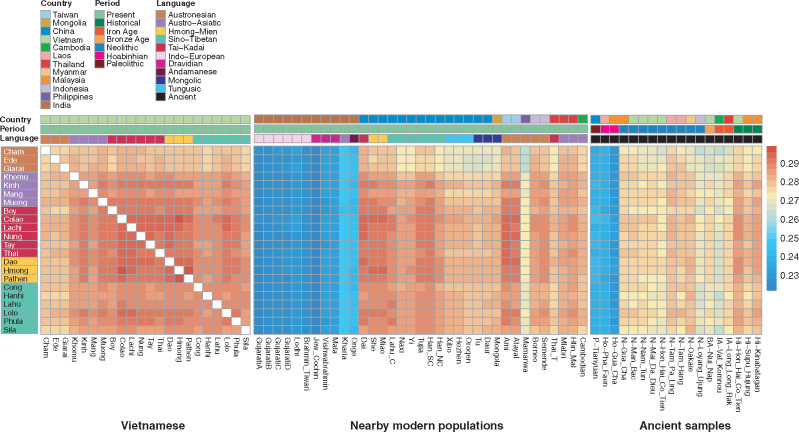
Fig. 4.
Heatmap of outgroup f3 profiles. A heatmap based on the values of the f3 statistic for all pairs of populations/ancient samples, using Mbuti as the outgroup. Shown are comparisons among the Vietnamese groups (left), with the nearby modern populations (middle), and with the ancient samples (right). The three different color bars at the top denote separately the countries, time periods, and language families, according to the key. The Vietnamese group labels are also shaded according to language family.

