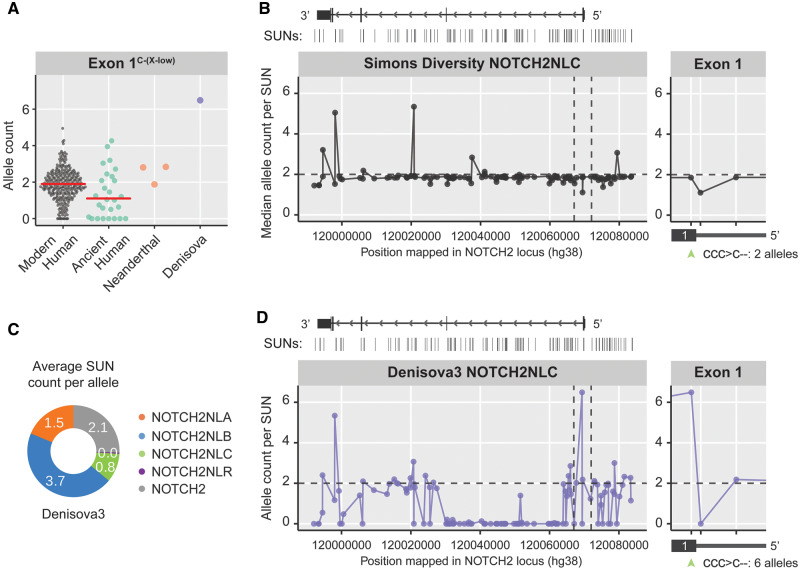
Fig. 4.
NOTCH2NLC configuration in Denisova3 compared with modern humans. (A) Plot showing the Exon1C-(X-low) allele count for modern humans, ancient humans, Neanderthals, and Denisovan. Note the unusual allele count for Denisovan. (B) Modern human’s median allele count plotted for each of the NOTCH2NLC-specific SUNs distributed along the NOTCH2NL locus. Vertical dashed lines indicate the region around Exon1. Zoom-in shows SUN count in Exon1, including the Exon1C-(X-low) variant indicated by green arrowhead. (C) NOTCH2NL allele counts in the Denisova3 genome, estimated from the average density of paralog-specific SUNs. (D) Denisova3 allele count plotted for each of the NOTCH2NLC-specific SUNs distributed along the NOTCH2NL locus. Zoom-in shows NOTCH2NLC SUN count in Exon1, including the Exon1C-(X-low) variant as indicated by green arrowhead.

