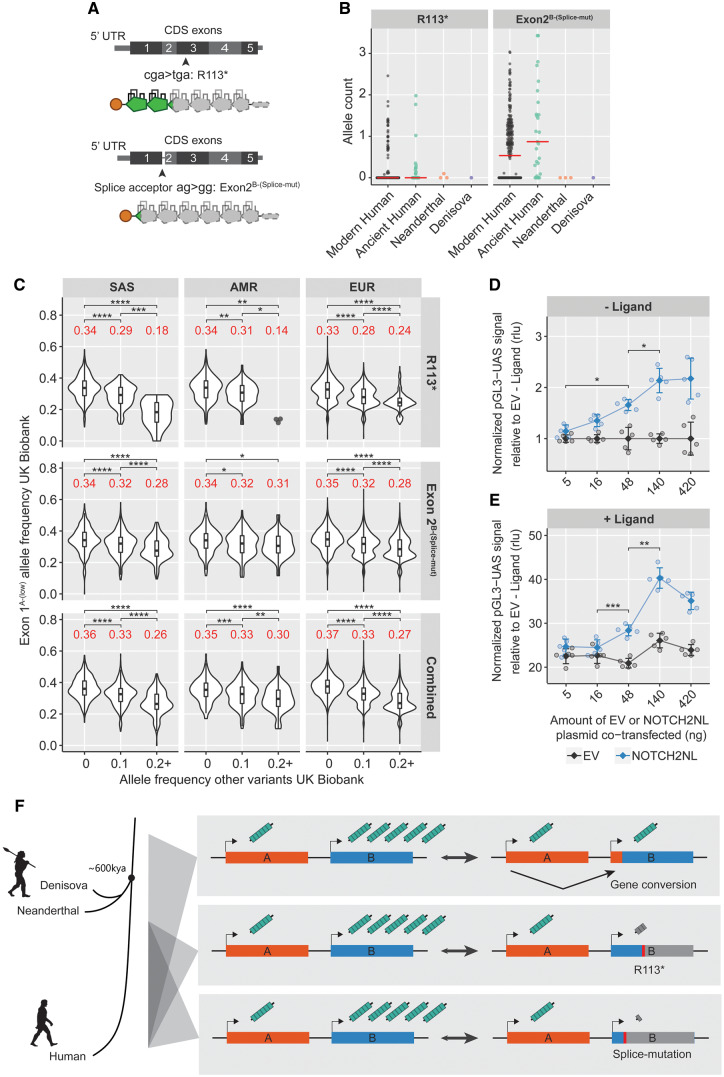
Fig.6.
Additional deleterious NOTCH2NL variants are present specifically in humans. (A) Overview of the R113* and Exon2B-(Splice-mut) deleterious variants on NOTCH2NL protein structure. (B) R113* and Exon2B-(Splice-mut) allele count in modern human and archaic genomes. (C) UK Biobank data for SAS, AMR, and EUR ancestries showing association of Exon1A-(Low) frequency with R113* frequency, Exon2B-(Splice-mut) frequency, and their combined total grouped by ancestry. R113* Kruskal–Wallis: SAS P = 2.2e-16, AMR P = 7.8e-5, and EUR P = 2.2e-16. Exon2B-(Splice-mut) Kruskal–Wallis: SAS P = 4.6e-15, AMR P = 0.04, and EUR P = 1.1e-15. Combined Kruskal–Wallis: SAS P = 2.2e-16, AMR P = 9.9e-7, and EUR P = 2.2e-16. Significant groups were followed by Dunn’s test. (D, E) Dose–response curve using increasing amounts of NOTCH2NL in the coculture NOTCH2 reporter assay. (D) NOTCH2 expressing cells are cocultured with U2OS (− ligand, analysis of variance [ANOVA] P = 7.4e-7, followed by Tukey’s test: *P < 0.05) or (E) U2OS-JAG2 (+ ligand, ANOVA P = 4.7e-9, followed by Tukey’s test: **P < 0.01 and ***P < 0.001) cells. n = 5 per condition, displayed as mean ± SD. (F) General overview schematic showing the impact of variants in NOTCH2NL genes on the production of NOTCH2NL protein and the time/lineage where they were segregating. Asterisks indicate significant values from Dunn’s post hoc tests: *P < 0.05, **P < 0.01, ***P < 0.001, and ****P < 0.0001. EAS N = 266, SAS N = 1,174, AMR N = 444, EUR N = 46,578, and AFR N = 1,087.

