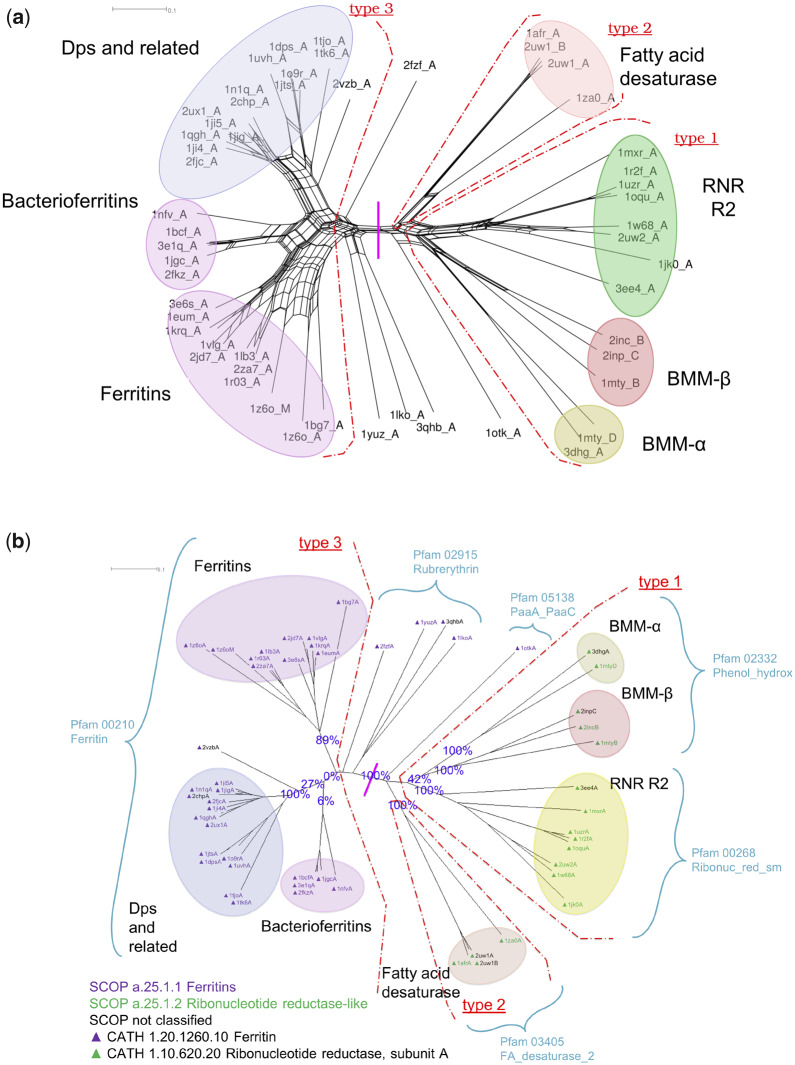
Fig. 10.
Structure-based phylogenetics of the ferritin-like superfamily. The color-coded ellipses are consistent with the previous study (Lundin et al. 2012) and labeled with annotations provided by the PDB (wwPDB Consortium 2008). The scale bars represent distance as quantified by the inverse Qscore. (a) NeighborNet network of the ferritin-like superfamily built from the structures as obtained from the PDB (wwPDB Consortium 2008). The red dot-dashed arcs separate the structures with three different dimerization types whose separate classification was used to assess the quality of the phylogenetic tree by Lundin et al. (2012). The vertical pink line marks the broad split between the two SCOP families, ferritins (a.25.1.1, left) and ribonucleotide reductase-like (a.25.1.2, right). (b) Structural phylogeny of the ferritin-like superfamily with statistical support from the structural bootstrap method. The bifurcating tree was built using the structures from which the simulations were initiated, with statistical support generated using MD simulations. Support values obtained from 100 samples of alternative conformations for each protein structure from the repertoire of 10,000 conformations generated during the production phase of the MD simulation are shown for key splits. SCOP and CATH classifications are shown by the color of the node labels and of the associated triangle, respectively, as per the embedded key. Pfam classifications are indicated by arcs.

