Fig. 1.
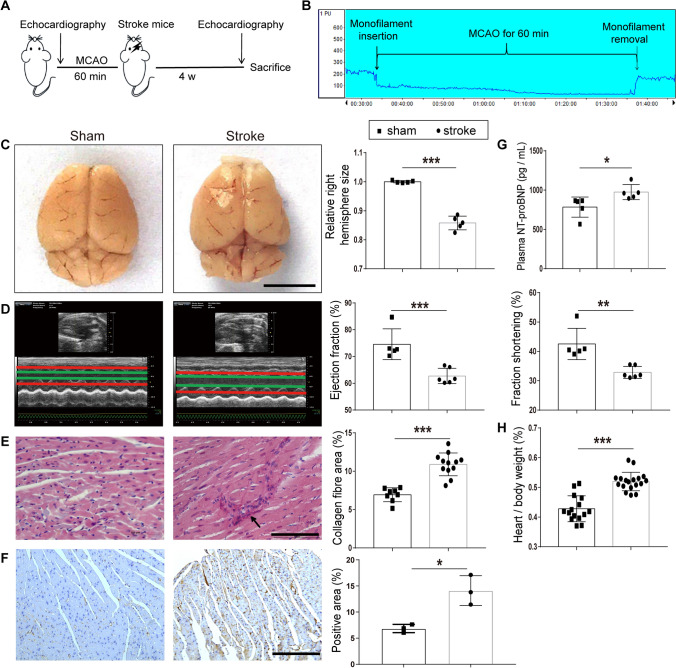
Cardiac dysfunction in MCAO mice. A Diagram of the MCAO model echocardiography protocol. B Example of laser Doppler measurement showing that MCAO sharply reduces cerebral blood flow (CBF) when the monofilament is inserted. CBF is restored after the monofilament is removed. C Changes in brain morphology and right hemispheric atrophy in the sham and stroke groups (n = 5 per group). D Left, examples of echocardiography in mice at day 28 after MCAO. Right, bar graphs show the ejection fraction and fractional shortening in the sham (n = 5) and stroke groups (n = 6). E Left, PicroSirius Red staining for interstitial collagen (arrow) in cardiac ventricular tissue. Right, interstitial collagen fraction in sham (n = 8) and stroke groups (n = 12). F Left, immunohistochemical staining for α-SMA in cardiac ventricular tissue. Right, α-SMA-positive area in the sham and stroke groups (n = 3 per group). G Plasma levels of NT-proBNP in the sham and stroke groups (n = 5 per group). H Heart/body weight ratio in the sham (n = 15) and stroke groups (n = 18). Data are expressed as the mean ± SD. *P < 0.05; **P < 0.01; ***P < 0.001 (Student’s t-test). Magnification, 400 × in E and 200 × in F; scale bars, 5 mm in C, 100 μm in E, and 50 μm in F.

