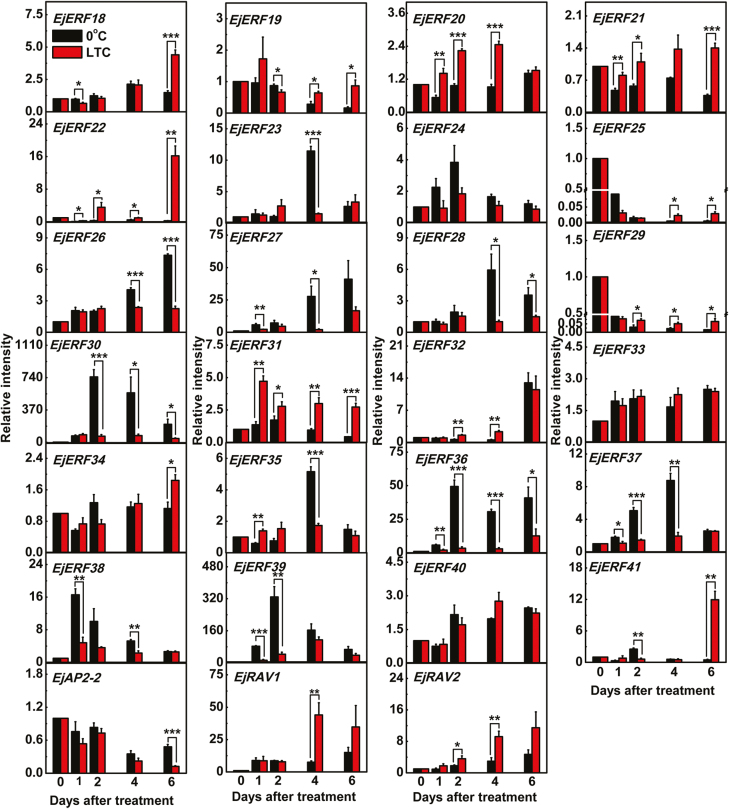
Fig. 2.
Expression levels of EjAP2/ERF genes in response to 0 °C and LTC treatments in LYQ loquat fruit. mRNA levels are presented as a ratio relative to the harvest time point (0 days), the value of which was set as 1. Error bars indicate the SE from three replicates. Statistical analyses were performed using Student’s t-test: *P<0.05, **P<0.01, ***P<0.001. The materials were collected and treatments conducted with three biological replicates as described by Zeng et al. (2015).

