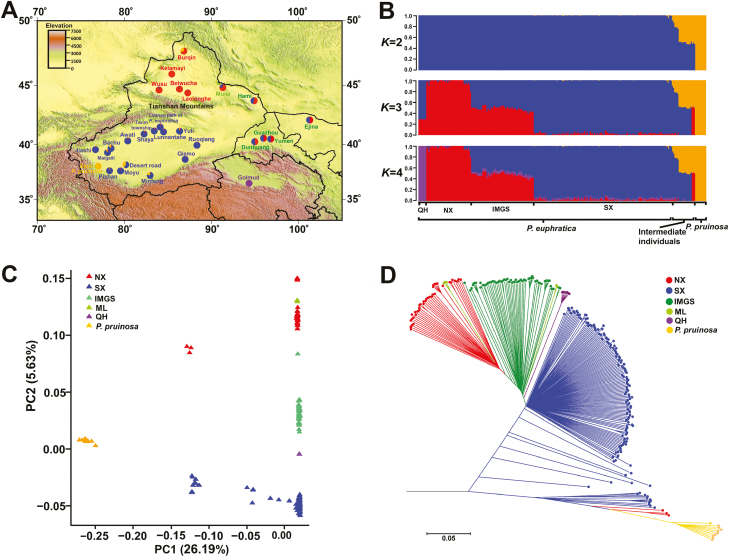
Fig. 1.
Population genetic structure and phylogenetic analysis of P. euphratica. (A) The geographical distribution of the natural populations of P. euphratica and P. pruinosa in northwest China. Each pie chart on the map represents the geographical distribution of the selected populations in our study, and its given colors correspond to the proportion of genetic clusters at K=4 (B). (B) Population stratification based on frappe software for K=2, 3, and 4. (C) Principal component analysis plots of the first two components. (D) Neighbor-joining tree based on the genetic distance.

