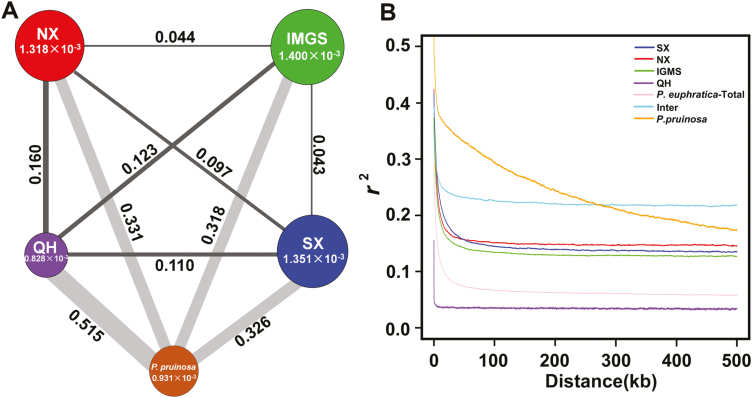
Fig. 2.
Genetic diversity and linkage disequilibrium analysis. (A) Nucleotide diversity (π) and genetic divergence (FST) across the four clades of P. euphratica and P. pruinosa. The value in each circle represents a measure of nucleotide diversity for the clade, and the circle size indicates the π value; the value on each line indicates genetic divergence between two clades, and the line width indicates the FST values. (B) LD decay analysis of different clades measured by r2. Inter refers to the intermediate clade with mixture of genetic components of P. euphratica and P. pruinosa.

