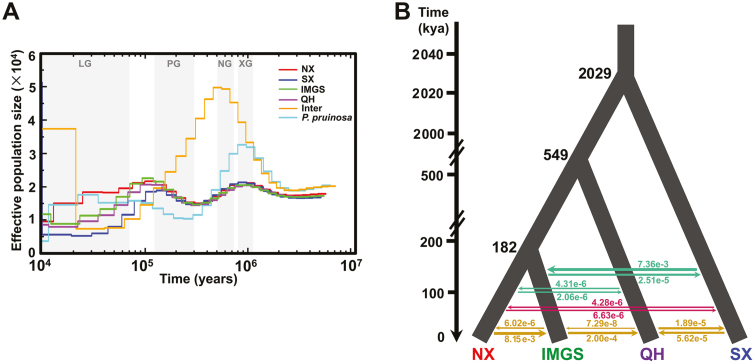
Fig. 3.
Demographic history of the four clades of P. euphratica. (A) Changes in effective population size (Ne) through time inferred by the pairwise sequentially Markovian coalescence model. The periods of the Xixiabangma glaciation (XG, 800–1170 kya), Naynayxungla glaciation (NG, 500–720 kya), penultimate glaciation (PG, 130–300 kya), and last glaciation (LG, 10–70 kya) are shaded gray. (B) Schematic representation of the best-fitting demographic model inferred by fastsimcoal26. The arrows indicate the per generation migration rate between clades to estimate gene flow. The inferred demographic parameters obtained from this model are shown in Supplementary Table S9.

