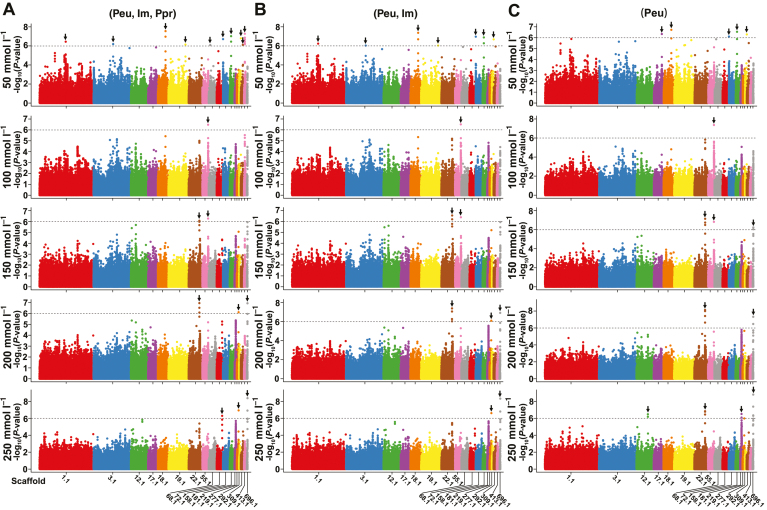
Fig. 4.
Manhattan plots for the seed salinity tolerance. (A) Manhattan plots for the GWAS of GRIs under five NaCl conditions using the first group that includes all 210 individuals (P. euphratica (Peu), intermediate (Im), Populus pruinosa (Ppr)). (B) Manhattan plots for the GWAS of the GRIs using the second group that contains 200 P. euphratica and intermediate individuals (Peu, Im). (C) Manhattan plots for the GWAS of the GRIs using the third group that contains only 187 P. euphratica individuals (Peu). The dashed line indicates the significance threshold (−log10(P-value)=6.0). Only scaffolds that are significantly associated with the GRIs are exhibited.

