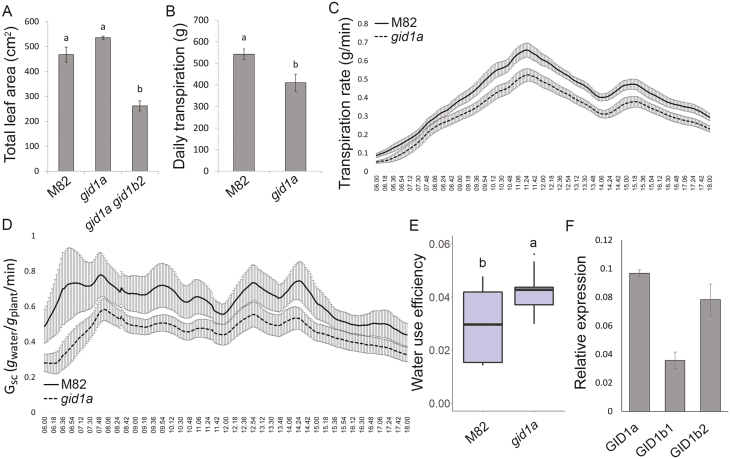
Fig. 2.
Loss of GID1a reduced whole-plant transpiration. (A) Total leaf area of control M82, gid1a, and gid1a gid1b2 6-week-old plants. Values are mean of nine plants ±SE. Lowercase letters represent significant differences between the lines (Student’s t-test, P<0.05). (B) Whole plant daily transpiration of M82 and gid1a. Plants were placed on lysimeters and pot (pot+soil+plant) weight was measured every 3 min. Values are means of 13 plants ±SE. Lowercase letters represent significant differences between respective lines (Student’s t-test, P<0.05). (C) Whole-plant transpiration rate over the course of 12 h (06.00–18.00 h). Values are means of 13 plants ±SE. (D) Whole canopy conductance (Gsc) of M82 and gid1a (calculated by dividing E (transpiration rate/plant weight) by vapor pressure deficit (VPD). Values are means of 13 plants ±SE. (E) Whole plant water use efficiency (WUE) of M82 and gid1a was calculated as the ratio between plant growth and transpiration. Data (taken from 13 different plants) are graphically presented as box and whisker plots. Lowercase letters represent significant differences between respective lines (Student’s t-test, P<0.05). (F) qRT-PCR analysis of GID1 expression in M82 isolated guard cells. Values are means of three biological replicates ±SE.

