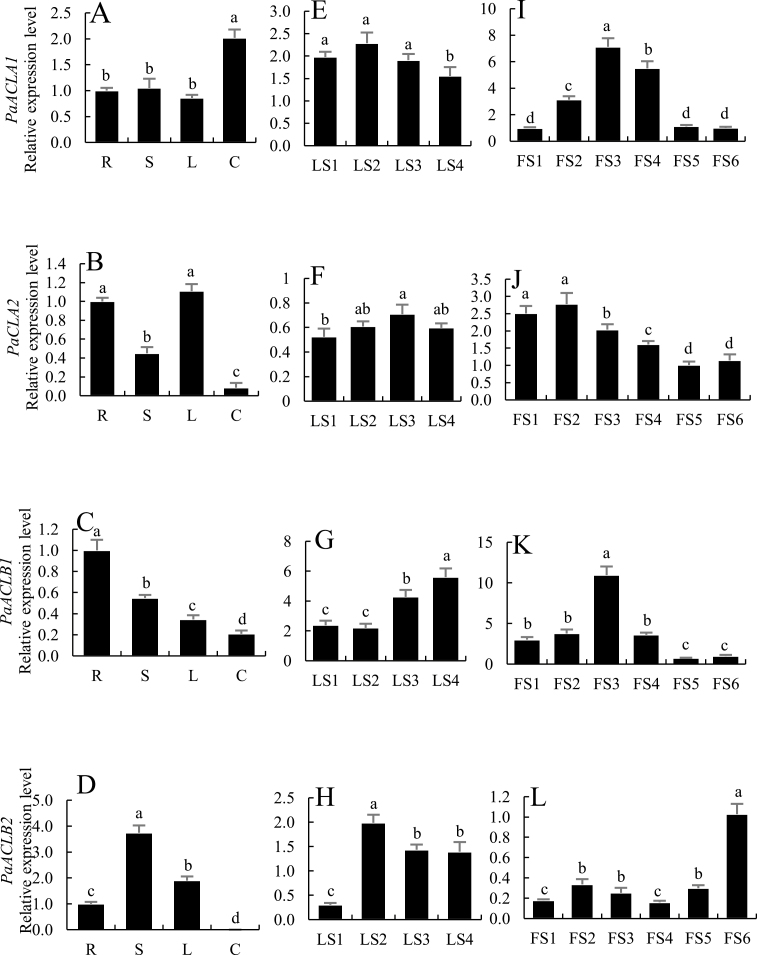
Fig. 1.
Expression patterns of PaACLAs and PaACLBs determined using quantitative real-time PCR. (A–D) Expression of PaACLA1 (A), PaACLA2 (B), PaACLB1 (C), and PaACLB2 (D) in different organs. R, roots; S, stems; L, leaves; C, corollas. (E–H) Expression of PaACLA1 (E), PaACLA2 (F), PaACLB1 (G), and PaACLB2 (H) during leaf development. LS1, young leaves (1 cm); LS2, growing leaves (3 cm); LS3, mature leaves (4 cm); LS4, old leaves. (I–L) Expression of PaACLA1 (I), PaACLA2 (J), PaACLB1 (K), and PaACLB2 (L) during flower development. Flower development stages: FS1 (0.5 cm in length), FS2 (1.0 cm), FS3 (2.0 cm), FS4 (3.0 cm), FS5 (4.0 cm), and FS6 (anthesis). Cyclophilin (accession no. EST883944) was used as the internal reference gene to quantify cDNA abundance. Data are presented as means ±SD (n=3). Different letters indicate significant differences (P≤0.05).

