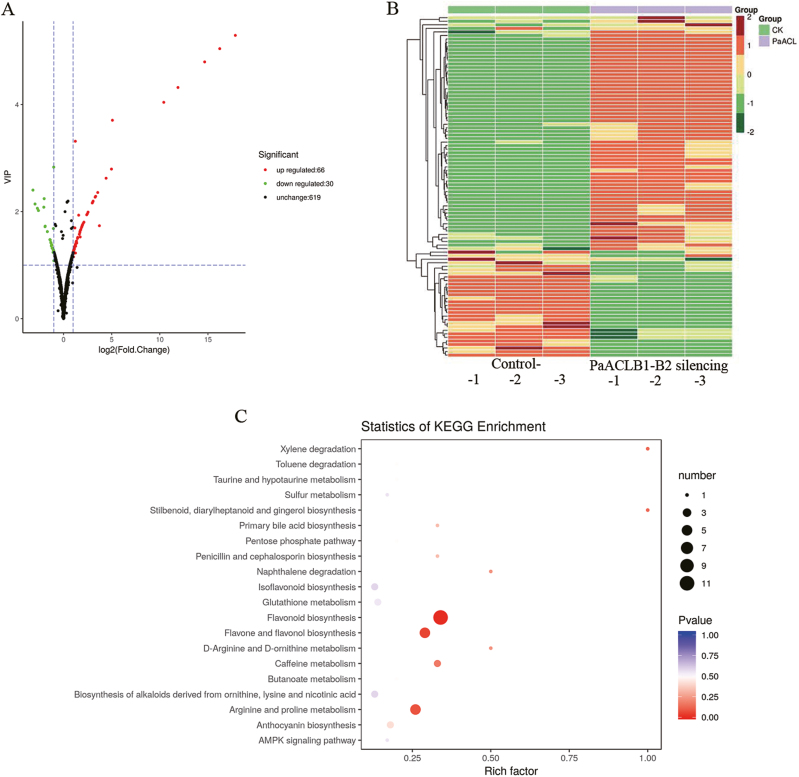
Fig. 6.
Analysis of the differential metabolites in PaACLB1-B2-silenced petunia corollas compared with controls. (A) Volcano plot. The green dots in the figure represent the differentially expressed metabolites that were decreased, the red dots represent the differentially expressed metabolites that were increased, and the black dots indicates metabolites for which there was no significant difference. (B) Heat map. Green indicates the differentially expressed metabolites that were decreased and red indicates the differentially expressed metabolites that were increased. The columns labelled control 1–3 and PaACLB1-B2 silencing 1–3 refer to corolla samples from independent plants. The tree on the left side of the map indicates the relationship among the metabolites according to the normalized contents of the metabolites in different samples. The smaller the differences between metabolite contents in different samples, the closer the two metabolites are placed in the tree. (C) KEGG enrichment analysis.

