FIGURE 3.

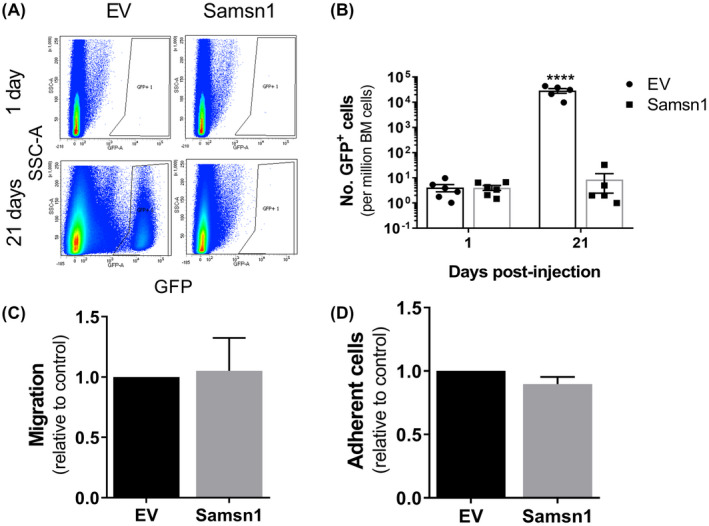
Samsn1 does not affect either 5TGM1 migration or BM homing, but does inhibit the expansion of BM‐migrated 5TGM1 cells. KaLwRij mice were injected with 5TGM1‐Samsn1 or 5TGM1‐EV cells i.v. and the number of GFP+ tumor cells in the long bones was determined by flow cytometry after 1 or 21 days. (A) Representative flow plots of GFP+ cells in the BM of mice inoculated with 5TGM1‐EV or 5TGM1‐Samsn1 cells after 1 day or 21 days are shown. (B) Graph shows the number of GFP+ tumor cells per million BM cells present in the long bones of mice injected with 5TGM1‐EV or 5TGM1‐Samsn1 cells after 1 and 21 days. Graph depicts the mean ± SEM of n = 5‐6 mice per cell line at each time point from one (21 days) or two (1 day) independent experiments. ****p < 0.0001, two‐way ANOVA with Sidak's multiple comparisons test. (C) Migration of 5TGM1‐Samsn1 and 5TGM1‐EV cells toward primary mouse BM stromal cell‐conditioned medium was assessed in a 24‐hour transwell assay. Results are expressed relative to the EV control cells. (D) 5TGM1‐Samsn1 or 5TGM1‐EV cells were seeded on a BM endothelial cell monolayer, and percent cell adhesion, relative to total cell input, was assessed by BLI after 15 min. Results are expressed relative to the EV control cells. Graphs depict the mean + SEM of six (C and D) independent experiments. p > 0.05, paired t test (C and D)
