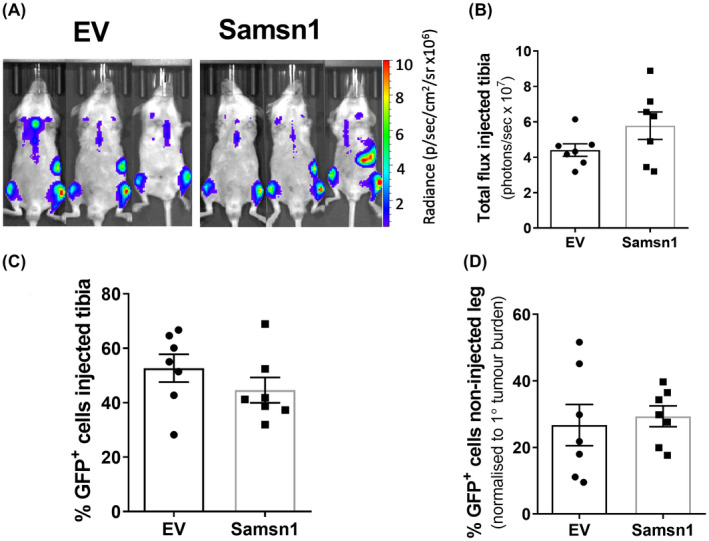
FIGURE 6.

Samsn1 expression in 5TGM1 cells does not affect tumor growth following i.t. injection into NSG mice. Samsn1‐expressing or EV control 5TGM1 cells were injected into the left tibiae of NSG mice and disease was allowed to develop for 23 days. (A) Tumor burden was measured by BLI on day 23 post‐tumor cell inoculation and representative ventral scans of the mice are shown. (B) The total flux from the injected leg was quantitated from the ventral BLI scans. (C) The percentage of GFP+ Samsn1‐overexpressing/EV 5TGM1 cells in the BM of the injected tibiae was determined by flow cytometry at the experimental endpoint. (D) The percentage of GFP+ Samsn1‐overexpressing/EV 5TGM1 cells in the BM of the non‐injected hind legs was determined by flow cytometry at the experimental endpoint. Results were normalized to primary tumor burden. Graphs depict the mean ±SEM of n = 7 mice per cell line from two independent experiments. p > 0.05, Mann–Whitney U test
