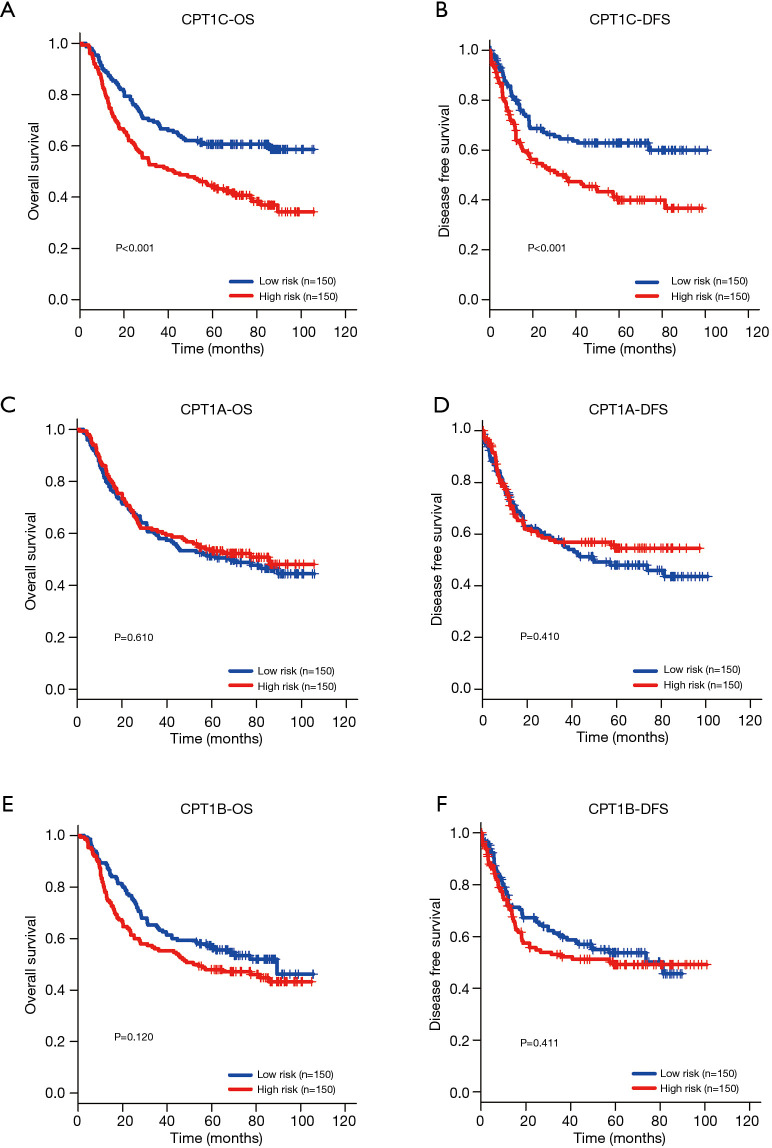
Figure 2.
Prognostic value of CPT1A, CPT1B and CPT1C in GC patients from GSE62254 dataset. (A,B) The Kaplan Meier survival curve demonstrated that there were significantly longer OS (P<0.001) and DFS (P<0.001) for patients with low CPT1C expression than those with high CPT1C expression. (C,D) Kaplan Meier survival analysis showed that relationship between CPT1A expression and OS and DFS of GC patients (P>0.05). (E,F) Survival curves of CPT1B in predicting OS and DFS for GC patients (P>0.05). GC, gastric cancer; DFS, disease free survival; OS, overall survival.

