Figure S1.
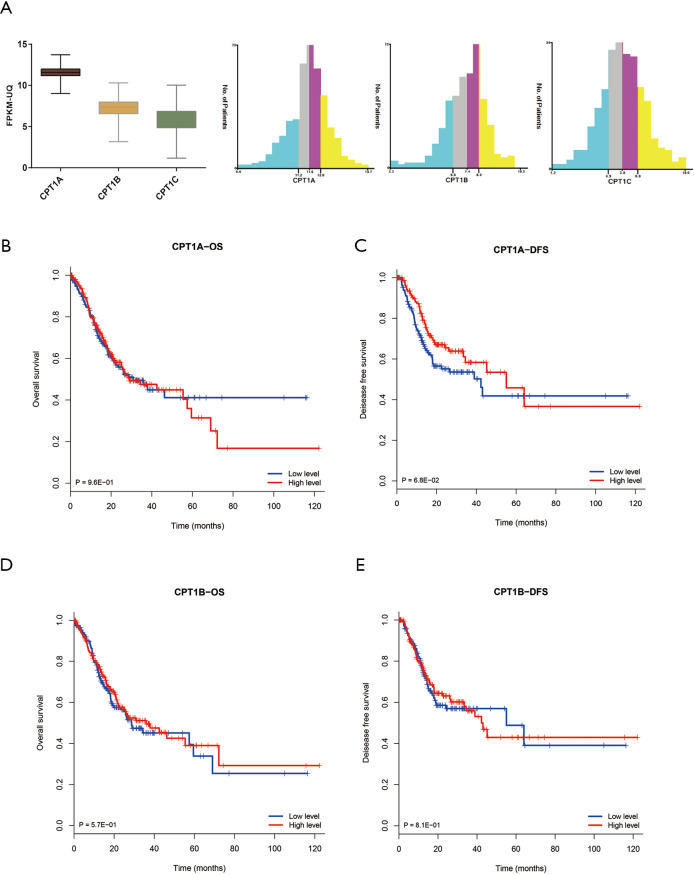
Distribution and survival analysis of CPT1 in TCGA database. (A) Distribution of CPT1A, CPT1B and CPT1C in GC patients. (B,C) Kaplan Meier survival analysis showed that relationship between CPT1A expression and OS and DFS of GC patients (P>0.05). (D,E) Survival curves of CPT1B in predicting OS and DFS for GC patients (P>0.05). TCGA, The Cancer Genome Atlas; GC, gastric cancer; DFS, disease free survival; OS, overall survival.

