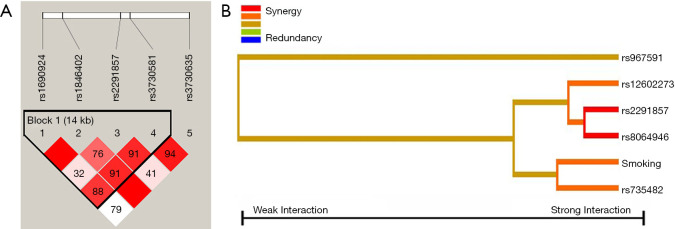
Figure 1.
(A) D’ LD map and LD plot of MDM2 five htSNPs generated by Haploview 4.2. One block was detected. The criteria of block partition were based on solid spine LD. The digit in the boxes represents D’ value (e.g., 99 means 0.99; 1 means 0.01; empty boxes means 1.0). Deep red boxes designate strong evidence of LD. Light red boxes designate uninformative. White boxes designate strong evidence of recombination. (B) Interaction dendrogram resulting from MDR analysis of 14 attributors in MDM2, PPP1R13L, CD3EAP, TP53 and smoking-duration [entropy-based IG (the value of information gain) for the SNP pairs]. Red bar and orange bar indicate the high-level synergies on the phenotype, while the brown indicate a medium-level interaction, green and blue connections indicate redundancy or lack of synergistic interactions between the markers.

