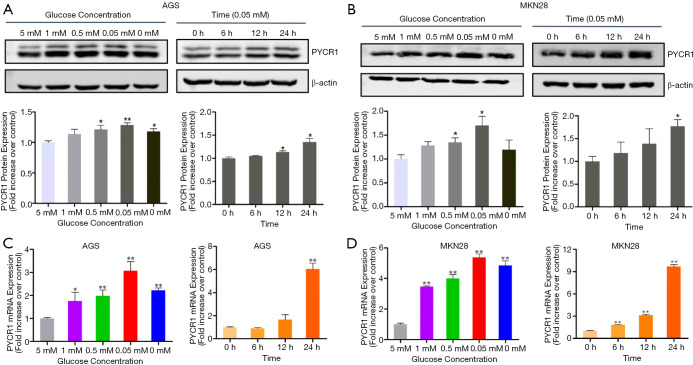
Figure 6.
Metabolic stress induced by glucose withdrawal upregulates PYCR1. (A,B) GC cells were exposure for 24 hours to medium with decreasing glucose concentration from 5 mM (control) to 0 mM (left panel), cells were treated with medium containing 0.05mM glucose and collected at indicated time points (0 h as control) (right panel). Levels of PYCR1 protein was detected by western blotting, densitometry analyses show the band density ratios of PYCR1 to β-actin in indicated cells (n=3). (C,D) PYCR1 mRNA level was measured by real-time RT-PCR using β-actin as an internal control. (n=3, *, P<0.05; **, P<0.001, by Student t test).

