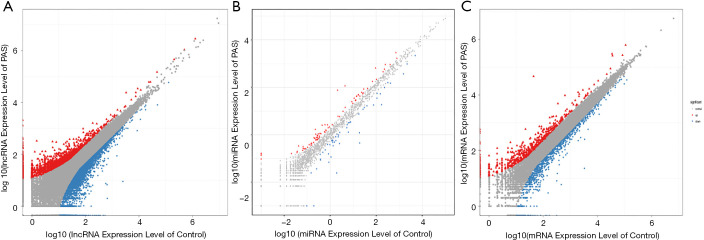
Figure 1.
Plots showing the expression levels of long non-coding (lnc), micro (mi), and messenger (m) RNA genes. Panels (A,B,C) show the log10-transformed expression of lncRNA, miRNA, and mRNA genes, respectively. Red triangles denote up-regulated genes, blue squares denote down-regulated genes, and grey dots denote non-regulated genes. PAS, placenta accreta spectrum.

