Figure 5.
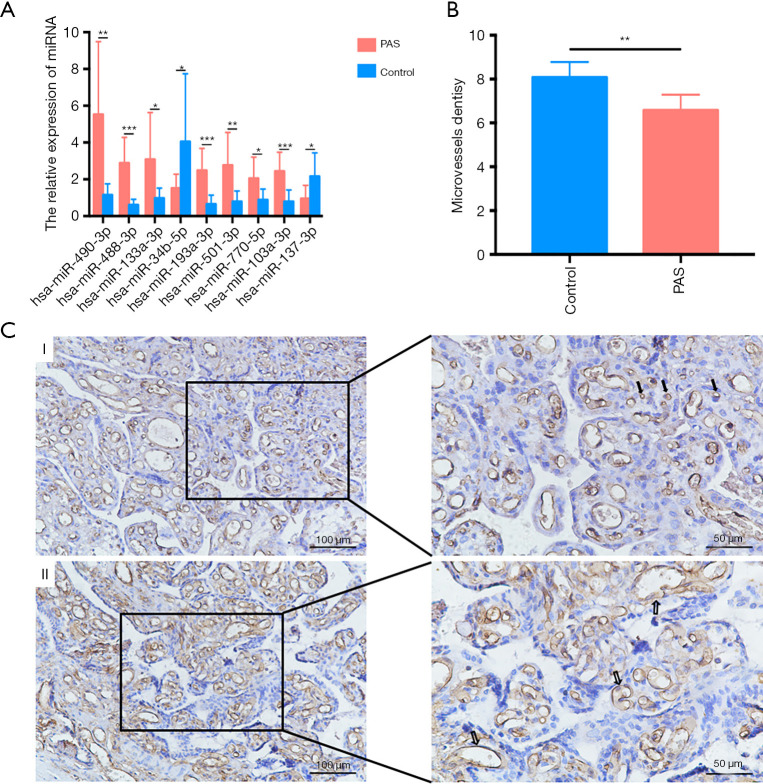
Validation of the RNA-sequencing and biological function of the competing endogenous RNA network. (A) The RT-PCR results showed that the expression of miR-490-3p, miR-488-3p, miR-133a-3p, miR-193a-3p, miR-501-3p, miR-770-5p, and miR-103a-3p was higher in the placenta accreta spectrum (PAS) group than in the control group, whereas that of miR-34b-5p and miR-137-3p was decreased. These results were consistent with those of RNA-sequencing; (B) compared with that in the control group, the PAS group exhibited lower microvessel density; (C) immunohistochemical staining of the vessel endothelial cell marker CD31: (I) represents the control group and (II) represents the PAS group. In each case, the left- and right-hand panels show vessels at ×200 and ×400 magnification, respectively. Solid and hollow arrows indicate microvessels and macrovessels, respectively. The control group showed a larger number of microvessels, whereas the PAS group showed a larger number of macrovessels. *, P<0.05; **, P<0.01; and ***, P<0.001.

