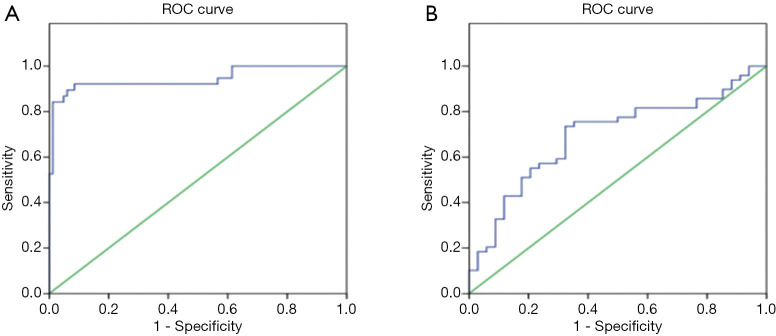
Figure 3.
ROC curve analysis of biomarker SAP130. (A) The derived area under the ROC (AUC) curve between IPF patients and healthy control subjects was 0.944 (95% CI, 0.810–0.997; cut-off 643.87 pg/mL; 92.1% sensitivity; 69.9% specificity). (B) The AUC of the ROC curve for the diagnosis of stable IPF versus AE-IPF diagnoses was 0.694 (95% CI, 0.580–0.809) for SAP130 (95% CI, 0.81–0.997; cut-off 741.46 pg/mL; 63.3% sensitivity; 67.6% specificity). SAP130, spliceosome-associated protein 130; ROC, receiver operating characteristic curve; AUC, area under curve; AE-IPF, acute exacerbation of idiopathic pulmonary fibrosis.

